
Description
Last week I earned something I’ve quietly worked toward for a long time: I became a SIAT Certified Technical Analyst, as a Professional Member of the Società Italiana di Analisi Tecnica, the Italian body of the International Federation of Technical Analysts (IFTA).
I could just post a photo of the certificate and move on. But that’s not why you read this blog. So instead, let me use this milestone to tackle a question I get all the time: isn’t technical analysis just drawing lines on charts?
Short answer: no. And the certification process is a good excuse to show you why, and how a systematic, data-first trader should actually think about it.
A personal note
When I left physics for the markets, the hardest habit to unlearn wasn’t the math. It was the tolerance for hand-waving. In a lab, a claim without a test is worthless. You measure, you validate, you reproduce, or you don’t get to call it a result.
For years I watched “technical analysis” get treated as the opposite of that: subjective patterns, gut feelings, a head-and-shoulders here, a magic Fibonacci level there. It kept me at arm’s length from the whole field.
What changed my mind was discovering the serious side of it. SIAT, founded in 1986, doesn’t teach you to eyeball charts. Its whole framing is scientific: algorithmic, statistical, and quantitative analysis of markets. That’s a language I speak. So I went through the process, and it reminded me of three principles worth sharing.
Principle 1 — A pattern is a hypothesis, not an opinion
The core mental shift is simple. Every claim you make about the market — “this level holds,” “this stock is seasonally strong in spring” — is a hypothesis. And a hypothesis is only worth trading if it survives a test.
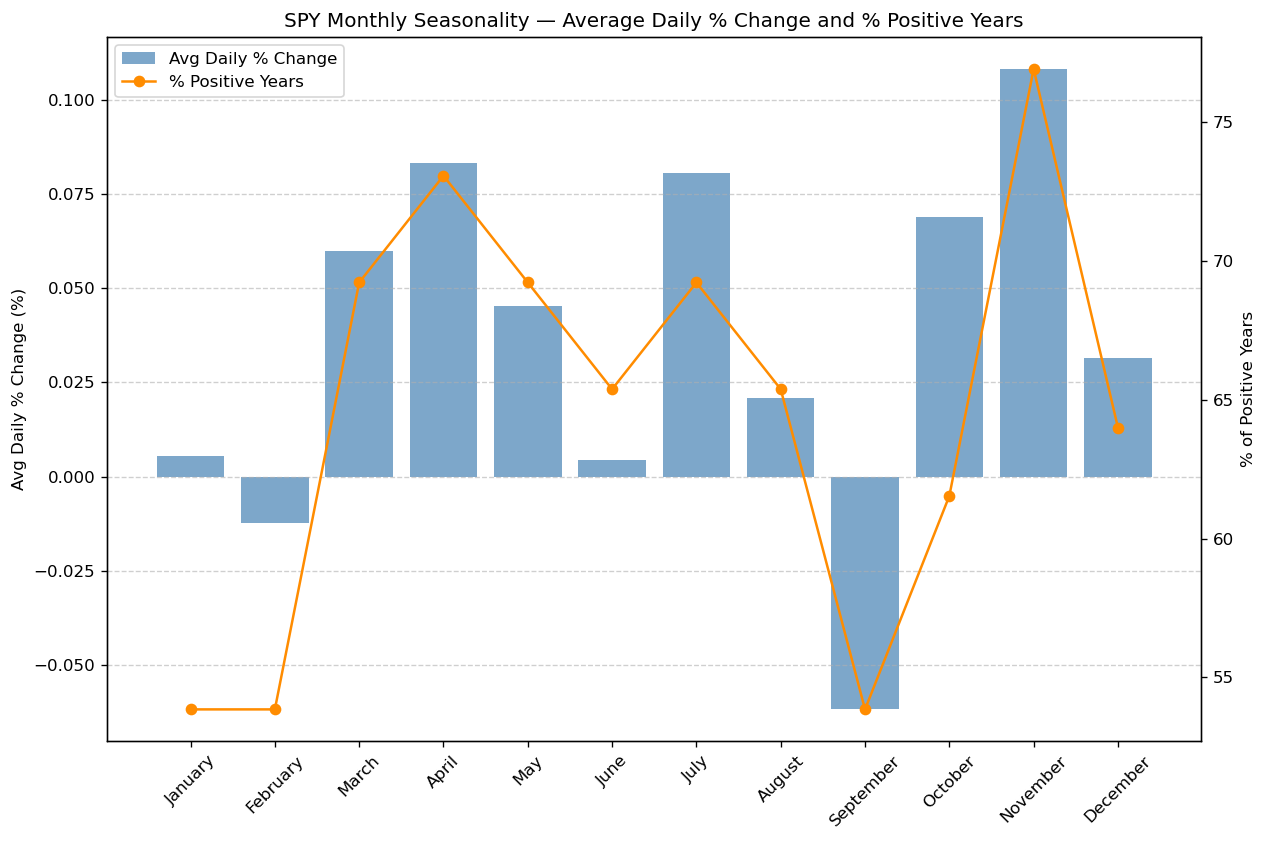
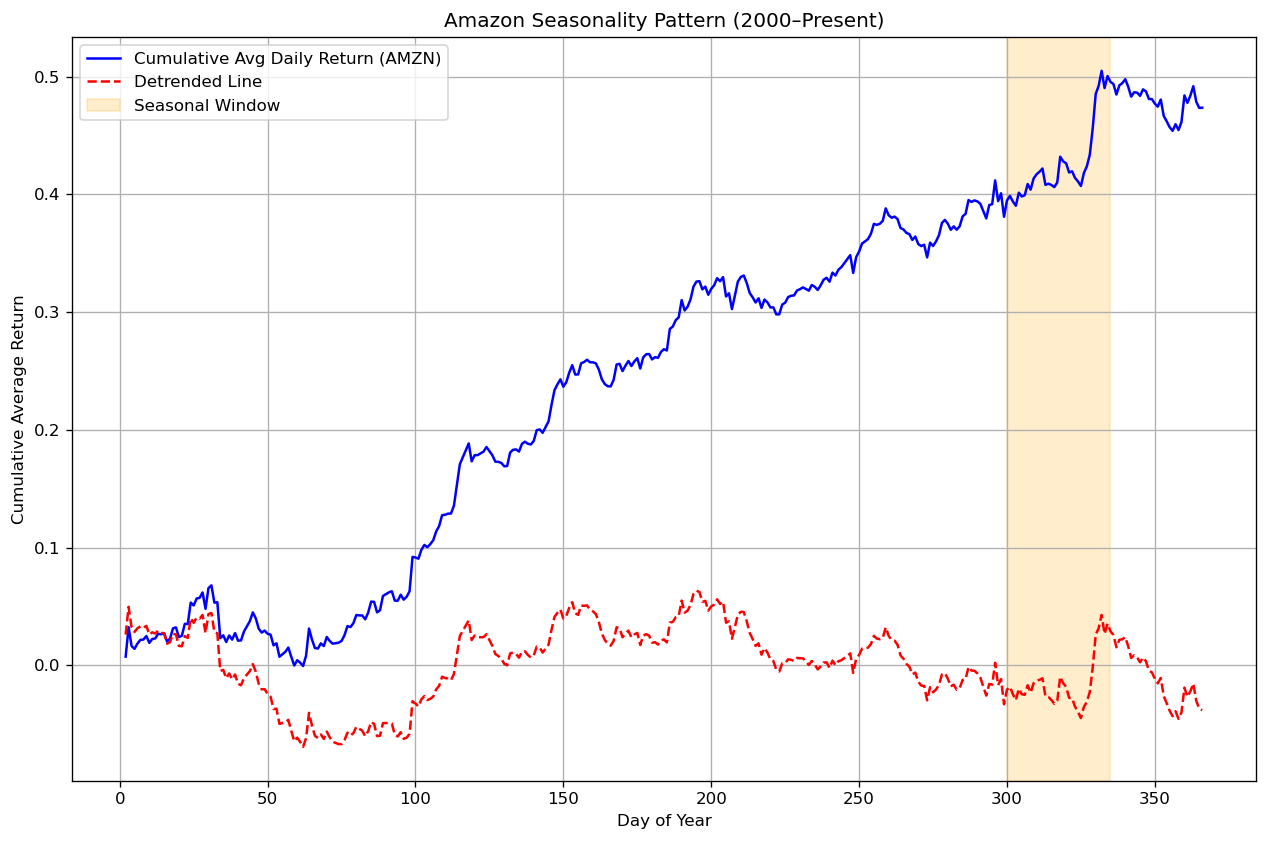
Take a seasonal claim, the kind of edge I trade every month. The undisciplined version is: “this stock always goes up in April.” The systematic version asks: over how many years? With what win rate? What’s the average return, and is it distinguishable from noise?
Here’s the difference in a few lines of Python:
import yfinance as yf
import pandas as pd

# Pull daily data. auto_adjust=True handles splits and dividends —
# essential when you're looking at five decades of history.
raw = yf.download("MCD", start="1970-01-01", auto_adjust=True)

# Recent yfinance versions return MultiIndex columns even for one ticker,
# so make sure we end up with a Series either way.
close = raw["Close"]
if isinstance(close, pd.DataFrame):
    close = close.iloc[:, 0]

# Reduce to monthly returns
monthly = close.resample("ME").last().pct_change().dropna()

# Group returns by calendar month
monthly = monthly.to_frame("ret")
monthly["month"] = monthly.index.month

summary = monthly.groupby("month")["ret"].agg(
    avg_return="mean",
    win_rate=lambda x: (x > 0).mean(),
    n_years="count",
)

print(summary.round(3))
Now the “pattern” is a table you can defend: average return, win rate, and sample size for every month. That’s the line between an opinion and an edge.
Principle 2 — Win rate is meaningless without sample size
This is where most retail analysis quietly falls apart. A pattern that “worked 8 out of 10 times” sounds convincing until you remember that 10 observations tell you almost nothing.
Here’s the honest question to ask before trading any pattern: if this edge didn’t exist at all, how often would I still see a result this good?
That’s the whole idea behind the p-value. Imagine the pattern is fake and the stock is a coin flip in that window — up half the time, down half the time. Now flip that coin ten times, over and over. How often do you get 8 heads or better, purely by luck?
We don’t have to guess. The binomial test answers it exactly:
from scipy.stats import binomtest

wins, trials = 8, 10          # your historical hits
result = binomtest(wins, trials, p=0.5, alternative="greater")

print(f"Win rate: {wins/trials:.0%}")
print(f"p-value vs. coin flip: {result.pvalue:.3f}")
The answer: p = 0.055. Roughly one time in eighteen, a coin produces 8-out-of-10 or better. So an 80% win rate over ten years is not strong evidence of anything. Show me twenty such “patterns” and one or two will look this good by pure chance — and if you screened thousands of instruments to find it, you should expect dozens of them.
Now compare that with a pattern that won 40 times out of 56 years:
| Pattern | Win rate | Sample | p-value |
|---|---|---|---|
| A | 80% | 10 years | 0.055 |
| B | 71% | 56 years | 0.0009 |
Pattern B has the lower win rate — and it’s the one worth trading. A coin produces B’s result less than once in a thousand attempts, so luck is a poor explanation for it. Pattern A’s result is comfortably within the range of noise.
That inversion is the lesson. The eye-catching number is the win rate; the number that actually determines whether you have an edge is how many independent observations stand behind it. Certification hammers this home: sample size is part of the signal, not a footnote.
Two caveats worth keeping in mind, because a p-value is a sanity check and not a green light. First, it says nothing about size — a pattern can be statistically real and still too small to survive commissions and spread. Second, the arithmetic assumes you tested one hypothesis, not ten thousand. If a screener surfaced this pattern out of a large universe, the threshold for believing it has to be far stricter. That’s exactly why I insist on out-of-sample validation before any seasonal setup makes it into the portfolio.
Principle 3 — Execution rules must exist before the trade
The last principle is the least glamorous and the most important. A validated pattern is useless if you can’t state, in advance, exactly when you enter, when you exit, and what invalidates the trade.
This is the bridge between analysis and a real system. A seasonal edge becomes a bull put spread with a defined entry date, a defined credit target, and a defined stop. No improvisation. The chart doesn’t tell you what to do — your pre-written rules do.
That discipline is exactly what separates a certified, systematic approach from screen-watching. The market doesn’t reward the cleverest pattern. It rewards the one you can execute the same way, a hundred times, without flinching.
Final Thoughts
The certification is a nice milestone, but the real takeaway isn’t the title — it’s the mindset it formalizes. Technical analysis done right is not chart astrology. It’s testable hypotheses, honest statistics, and mechanical execution. In other words: the same quantitative discipline I try to bring to every strategy on this blog.
If you take one thing from this: stop asking whether a pattern looks good. Start asking whether it survives a test. Everything else follows from there.
This is the mindset behind The Quantitative Edge — simple ideas, implemented cleanly, that scale into powerful tools for data-driven trading.
Statemi bene!