Description
Markets may appear chaotic, but under the intrinsic noise and unpredictability, some patterns quietly repeat.
These seasonal effects — recurring behaviors tied to the calendar — can create subtle yet measurable edges for quantitative traders.
Before diving into specific examples and known seasonal effects, like the SPY’s year-end rally, let’s explore what seasonal trading really is, why it exists, and how it can be tested and traded systematically.
What Is Seasonal Trading?
Seasonal trading is the study and exploitation of calendar-based regularities in asset prices. Instead of reacting to technical setups or news, seasonal traders look for recurring performance patterns at specific times of the year, month, or week. There is also a possibility to explore and study those effects by varying the day windows and checking what is the most profitable. This will be treated in one of the next blogs.
Some well-known seasonal examples include:
- The January Effect — small-cap stocks often rise as fresh capital enters after year-end.
- Sell in May and Go Away — equities tend to underperform during the summer months.
- The Santa Claus Rally — stocks often rise in the final days of December.
- Turn-of-the-Month Effect — equities drift higher around month-end due to inflows.
These patterns are not predictions but probabilistic edges — tendencies that, when properly measured and managed, can be integrated into quantitative strategies.
Why Do Seasonal Patterns Exist?
The reasons are both economic and human behavioral effects:
- Economic cycles: company fiscal years, budget resets, and tax deadlines influence capital flows.
- Investor psychology: optimism peaks in January, caution dominates in summer.
- Institutional behavior: dividends, pension allocations, and fund rebalancing follow the calendar.
- External factors: holidays, weather, and even political cycles impact risk appetite.
While some effects have weakened in recent decades (due to arbitrage and algorithmic trading), they haven’t disappeared — they’ve evolved.
As the 2025 data shows, August and September remain statistically weak months, while November and December consistently deliver outsized returns.
Seasonality is not about predicting the future; it’s about quantifying the historical rhythm of the market.
Case Study: Amazon’s Seasonal Patterns
Let’s look at a concrete example — Amazon (AMZN).
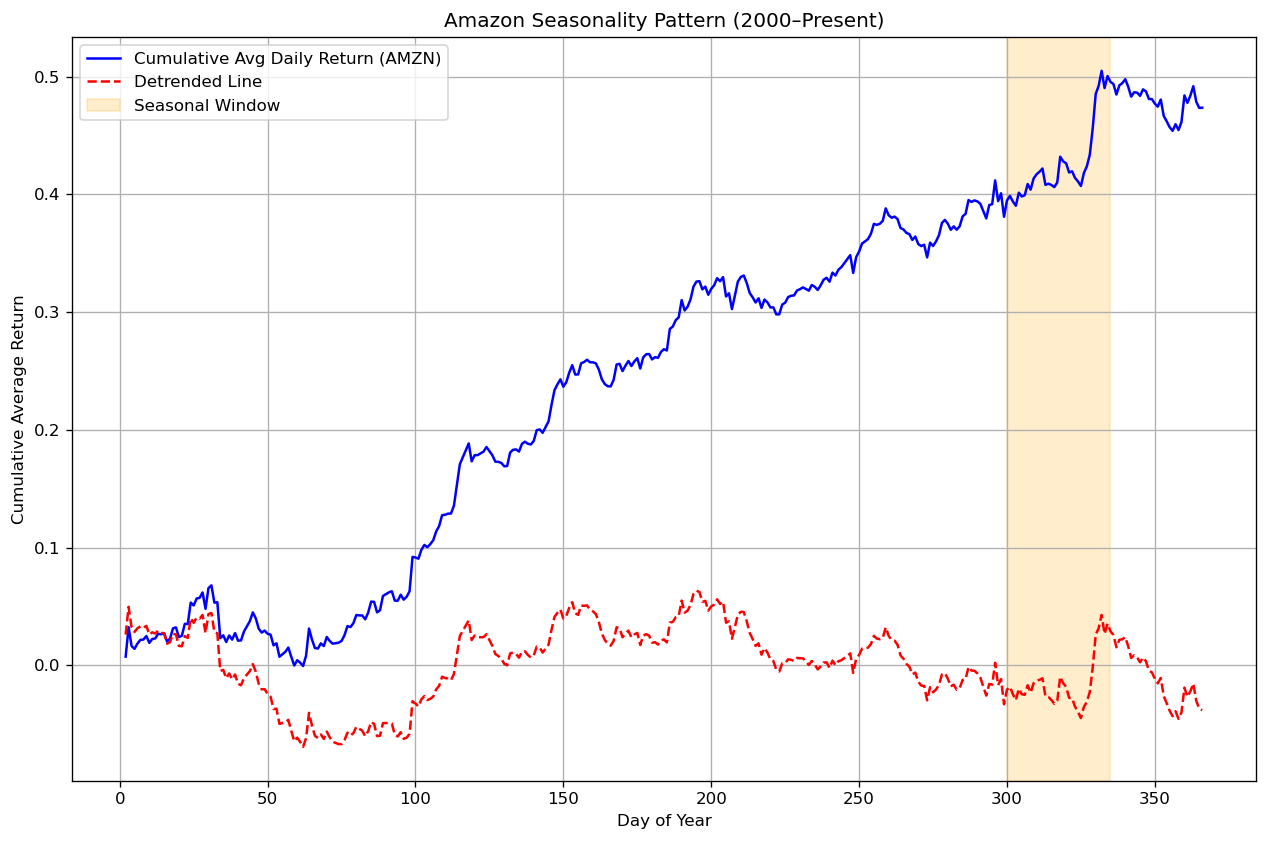
Since its IPO, Amazon has shown strong seasonal behavior around year-end and during mid-year retail cycles.
This isn’t surprising: Amazon’s business is directly linked to consumer spending, and its revenues surge in Q4 during the holiday season.
Below is a simple Python-based framework to detect these patterns.
import yfinance as yf
import pandas as pd
import matplotlib.pyplot as plt

amzn= yf.Ticker("AMZN")
data = amzn.history(period='25y',interval='1d', auto_adjust=False)

# Calculate daily returns
data ['Return'] = data ['Adj Close'].pct_change()
data ['DayOfYear'] = data .index.dayofyear

# Compute average daily returns by calendar day
avg_daily = data.groupby('DayOfYear')['Return'].mean()
cum_avg = avg_daily.cumsum()

# Plot
plt.figure(figsize=(10,6))
plt.plot(cum_avg, label='Cumulative Avg Daily Return (AMZN)')
plt.title('Amazon Seasonality Pattern (2000–Present)')
plt.xlabel('Day of Year')
plt.ylabel('Cumulative Average Return')
plt.legend()
plt.grid(True)
plt.show()
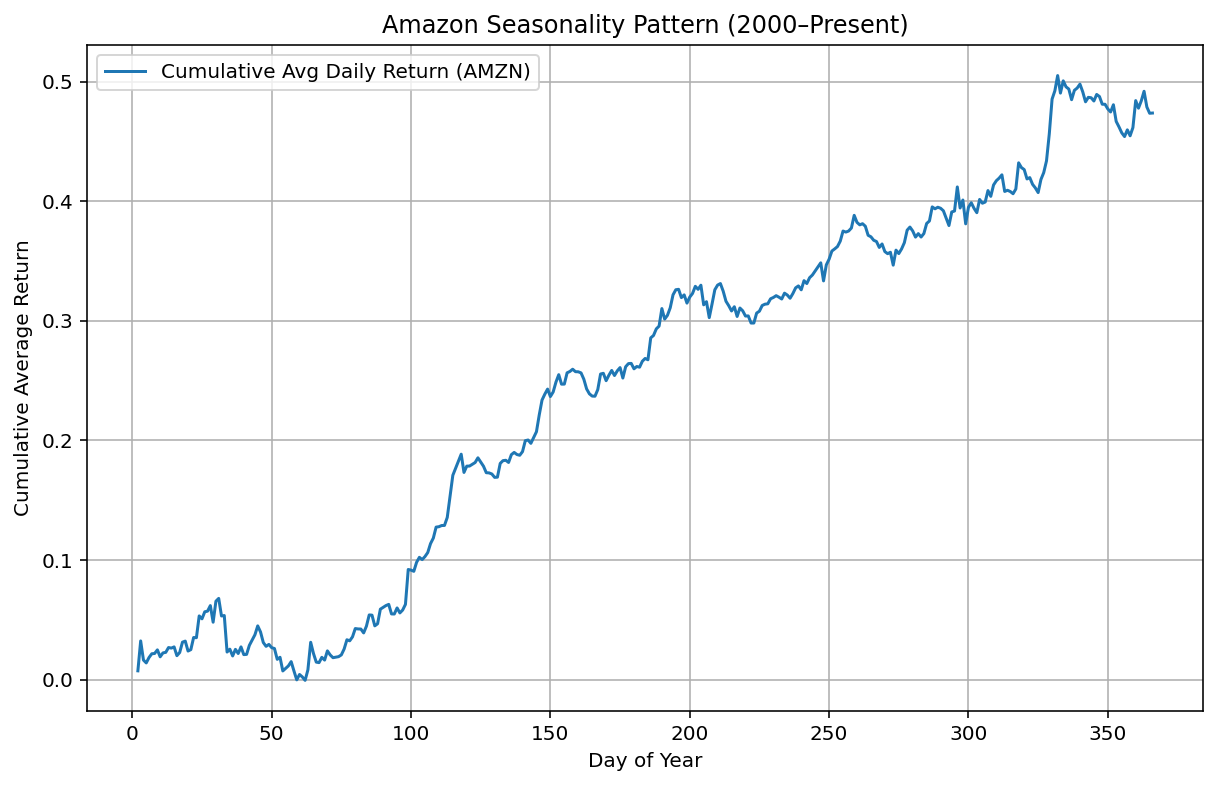
Running this shows clear uptrends around:
- Late October to mid-December (holiday shopping buildup).
- July (Prime Day and mid-year promotional spikes).
These are not coincidental — they align with Amazon’s business cycles and investor sentiment.
How Seasonality Creates an Edge
A seasonal edge emerges when a trader identifies a time-based bias that consistently tilts probabilities in one direction. The edge doesn’t need to be large — even a few basis points of advantage can compound significantly when applied systematically.
For instance:
- If Amazon tends to outperform in November–December by +5% on average, then entering a long position or option call spread around late October may have a statistical tailwind.
- Similarly, periods like August–September often bring short-term weakness, offering better entry points for long-term investors.
The goal isn’t to predict exact moves, but to trade with the calendar wind at your back.
Building and Testing Seasonal Strategies
Quantitative seasonal analysis typically follows these steps:
- Collect data: daily prices over multiple decades.
- Group by day or month of the year.
- Average returns across years to find consistent tendencies.
- Visualize cumulative average returns.
- Validate robustness: test on different periods, use out-of-sample checks.
Once seasonal windows are identified, traders can:
- Trade the underlying asset directly.
- Express exposure through options (bull call or bull put spreads).
- Build a portfolio of seasonals across multiple stocks or sectors (e.g., S&P 500 components).
Seasonality on its own is not a trading system — it’s an information layer that can enhance timing and risk allocation within broader quantitative models.
Final Thoughts
Seasonal trading is about recurring calendar-based market behaviors. A more fine-tuned approach would be to look at the best day window through the year and identify hidden patterns. These edges can be exploited through systematic trading or options structures tuned to the expected move. However, robust validation and sensitivity analysis are essential to find a more stable day window. I’ll explore that in future articles dedicated to testing and ranking seasonal strategies.
This is the mindset behind The Quantitative Edge — simple ideas, implemented cleanly, that scale into powerful tools for data-driven trading.
Statemi bene!