Description
Earlier this year, together with Gaetano Di Prima (an indipendent trader and good friend), I published an article in the May 2026 issue of Technical Analysis of Stocks & Commodities (S&C V.44:05). We presented a regime-based allocation framework that classifies the U.S. equity market into three states: Risk-On, Caution, and Risk-Off, only using trend, volatility, and credit conditions.
The original research covered almost two decades of history. But history is comfortable. The real question is different: how does the model behave in live market conditions, on data it has never seen?
So I ran the framework from January 1, 2025 through today. Eighteen months that included two genuine corrections: the spring 2025 selloff and the February–March 2026 risk-off wave I covered in my newsletter. This is the stress test. And the results tell a story worth reading.
A Quick Recap: Three Lenses, One Classification
If you read the S&C article, you can skip ahead. If not, here is the framework in one minute.
Most timing tools rely on a single signal. A moving average. A volatility threshold. The problem is that real market stress rarely announces itself through one channel. The trend can look fine while credit quietly deteriorates. Volatility can spike while the trend holds. One indicator alone will either miss the turn or whipsaw you to death.
The model combines three independent lenses:
Trend. Is SPY above its 200-day simple moving average? This is the structural filter. Simple, binary, deliberately unsophisticated.
Volatility term structure. Is the VIX below the VIX3M? Contango means the market prices near-term risk as normal. In Backwardation the short-term volatility is above long-term, a signature of acute stress.
Credit conditions. The rolling Z-score of the HYG/IEF ratio. Credit investors are often the first to smell trouble. When investors rotate out of high-yield bonds and into Treasuries, the Z-score turns negative, often before equities begin to deteriorate.
The aggregation is pure classification, no scoring, no optimization. All three lenses favorable: Risk-On, 100% equity exposure. Two or more unfavorable: Risk-Off, 0% exposure. One dissenting voice: Caution, 50% exposure. That intermediate state matters. Markets rarely flip like a switch, and the Caution regime absorbs the transition without forcing binary all-in/all-out decisions.
The full implementation is available on my GitHub: fbaru-dev/regime-framework. Everything runs on free Yahoo Finance data. No black boxes.
The Test: January 2025 to July 2026
I fed the model 18 months of out-of-sample data. All parameters identical to the published article. No re-fitting, no adjustments. What the model saw, you could have seen in real time.
Let’s walk through what happened, regime by regime.
Spring 2025: The First Real Test
January 2025 started calm. The model sat comfortably in Risk-On and collected +2.2% in the first month. Then February turned soft, and by early March all three lenses began to disagree with each other.
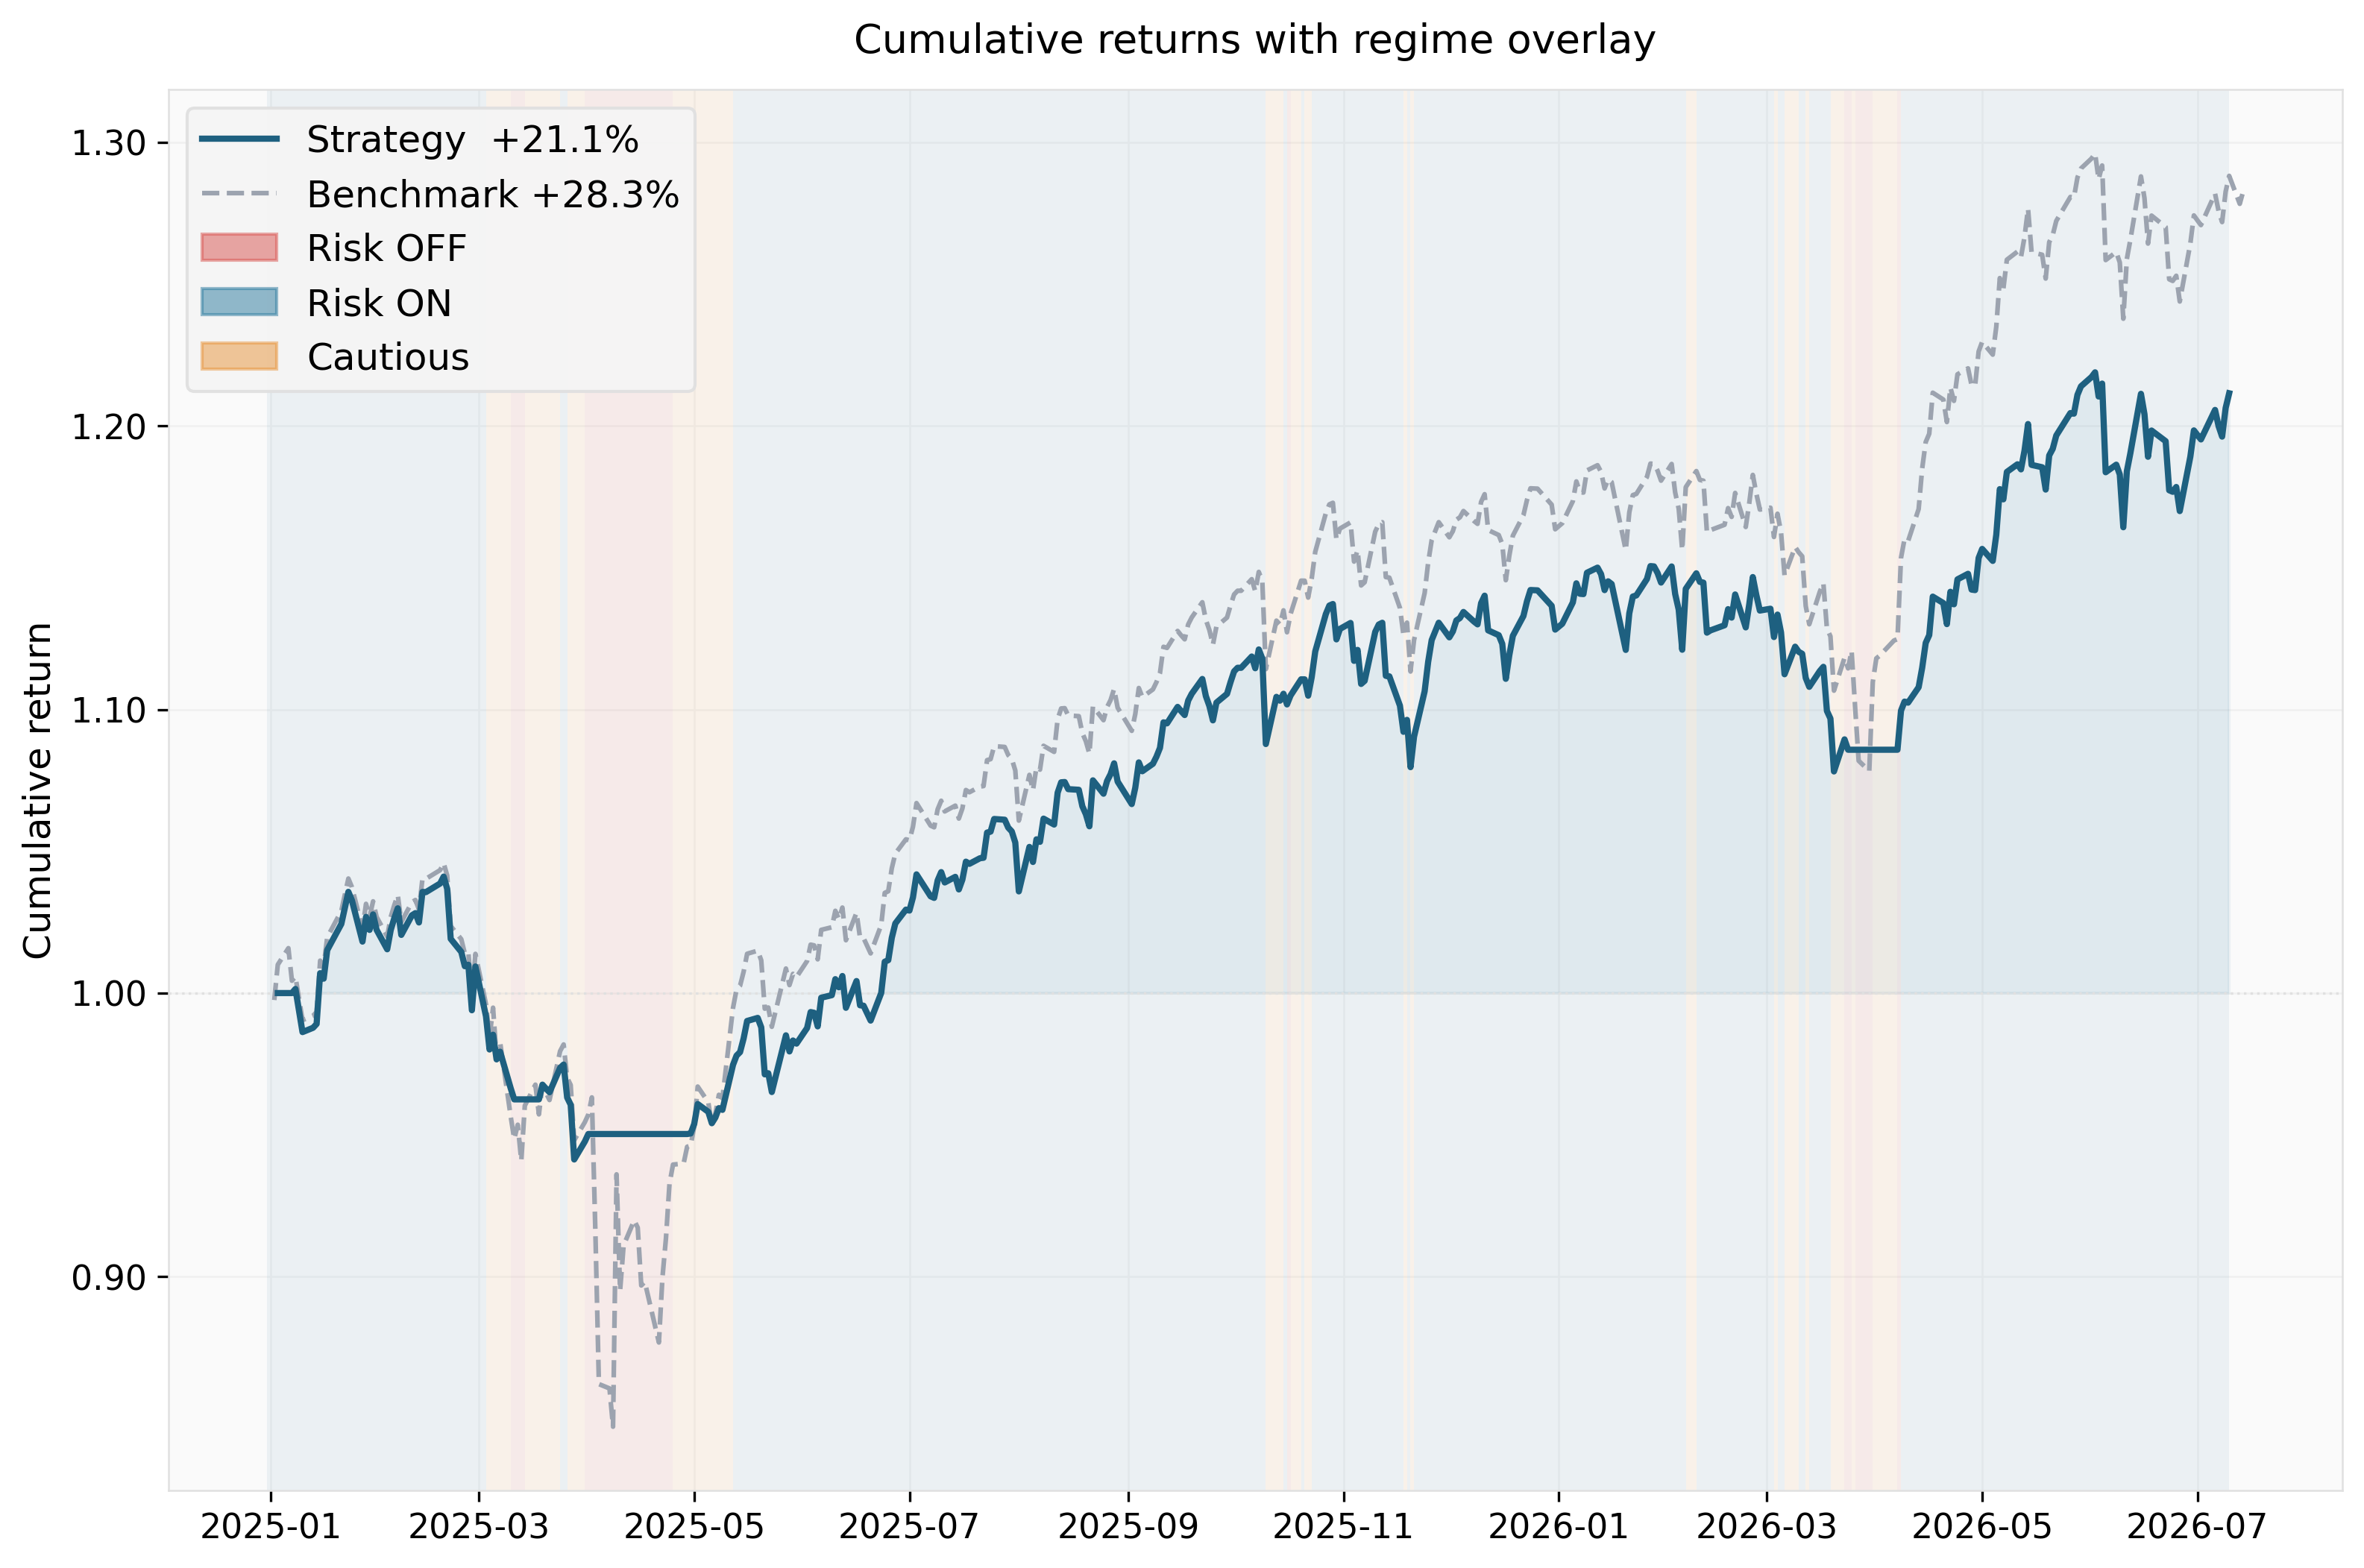
This is exactly the environment the framework was designed for. The trend broke first. Then volatility flipped into backwardation. Then credit spreads widened. The model cascaded from Risk-On through Caution into full Risk-Off, cutting exposure to zero through the worst of the April decline.
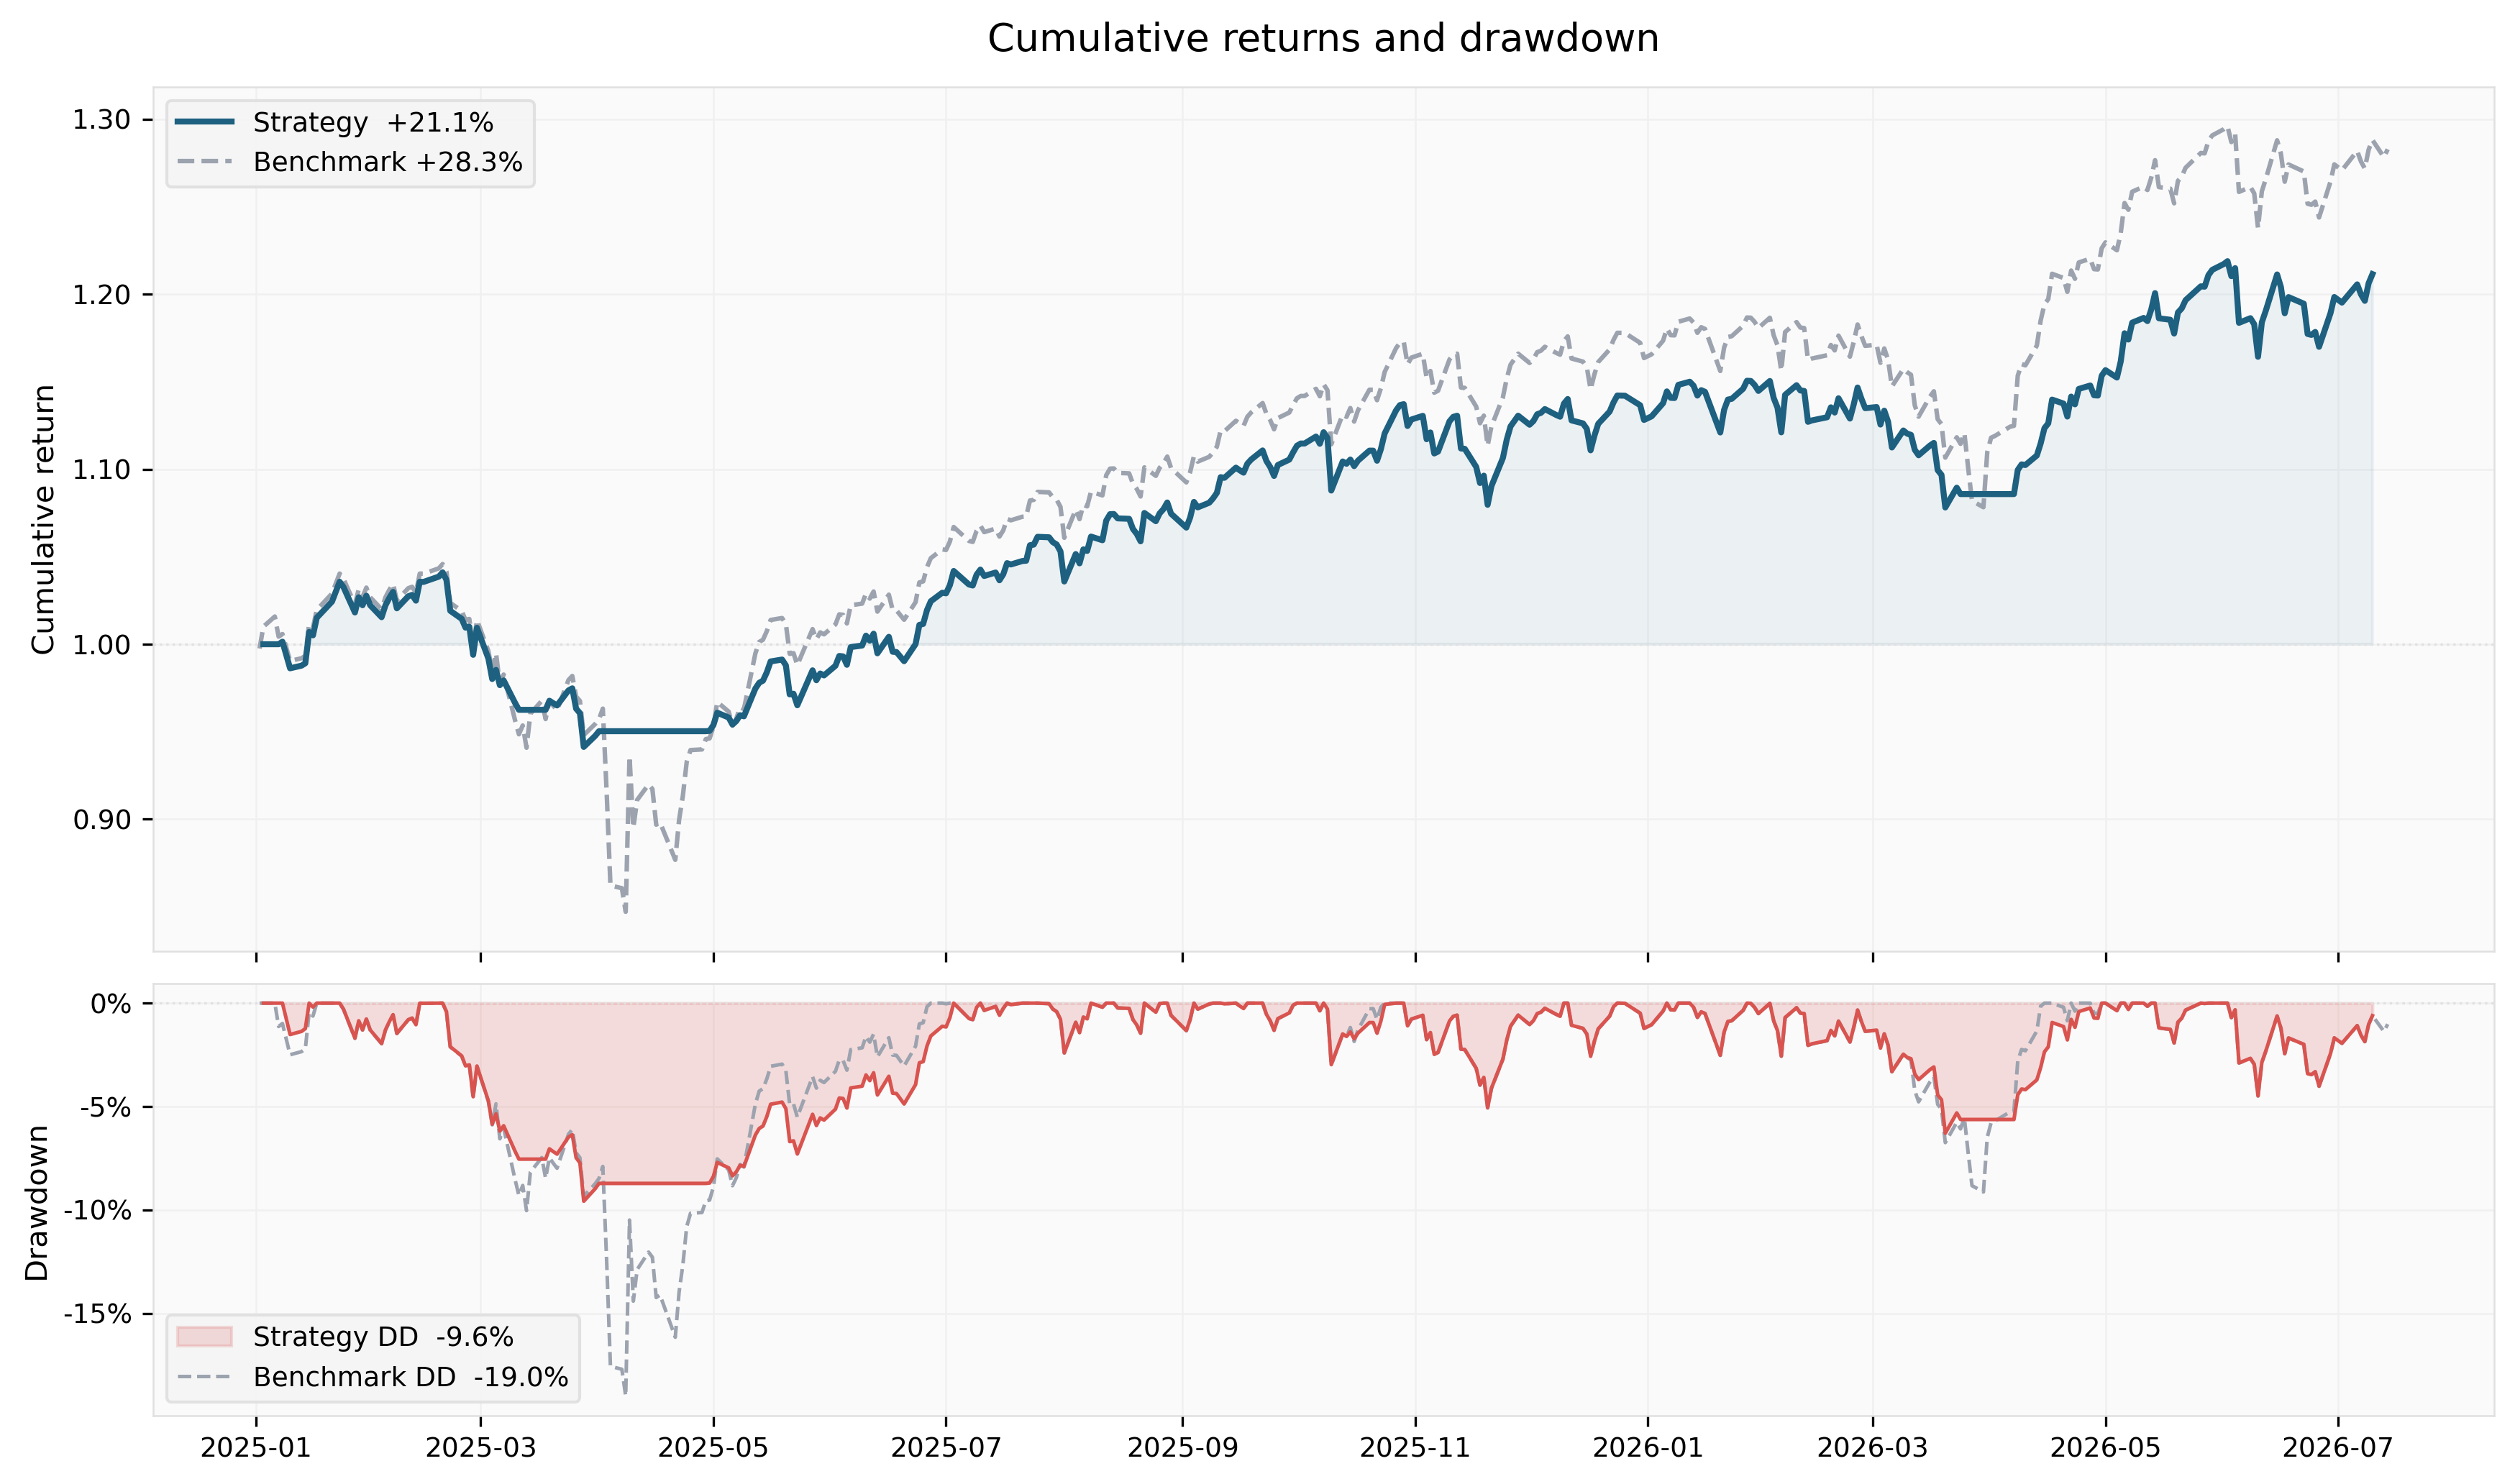
The numbers make the case better than words. SPY’s drawdown reached -19% peak-to-trough. The framework’s drawdown stopped at -9.6% — almost exactly half. March cost the strategy -6.1%, painful but survivable, and by sitting in cash through the ugliest stretch, the model simply refused to participate in the capitulation.
Here is the part critics always point out: the model also missed the first days of the rebound. April was nearly flat (+0.3%) while the market snapped back violently. That’s the tax you pay. Regime models are reactive by construction. They will never catch the exact bottom, and they don’t try to. The framework re-entered through Caution in May, was fully invested by early summer, and rode the recovery: +3.3%, +4.8%, +2.3% in May, June, and July.
The Quiet Middle: Staying Invested Is a Skill Too
From summer 2025 through January 2026, the model did the most underrated thing a risk system can do: nothing. Aside from two brief Caution flickers in the autumn, it stayed fully invested and compounded alongside the market.
This matters more than it seems. A risk model that constantly de-risks on every wobble destroys returns through whipsaw. The three-lens design filters out noise: a single indicator flashing red only downgrades you to Caution, not to the sidelines. One flicker in late October, one in November, both resolved within days. The cost of these false alarms was minimal.
February–March 2026: The Correction I Wrote About
If you follow my newsletter, you know what happened next. February 2026 turned heavy, and March delivered a genuine correction: SPX down -4.4% for the month, VIX breaking above 25 for the first time in the year, small-caps leading the market lower. In the newsletter I called it what it was — real risk repricing, not profit-taking.
The model agreed. Through late February and March it oscillated between Caution and Risk-Off as the three lenses degraded one after another.
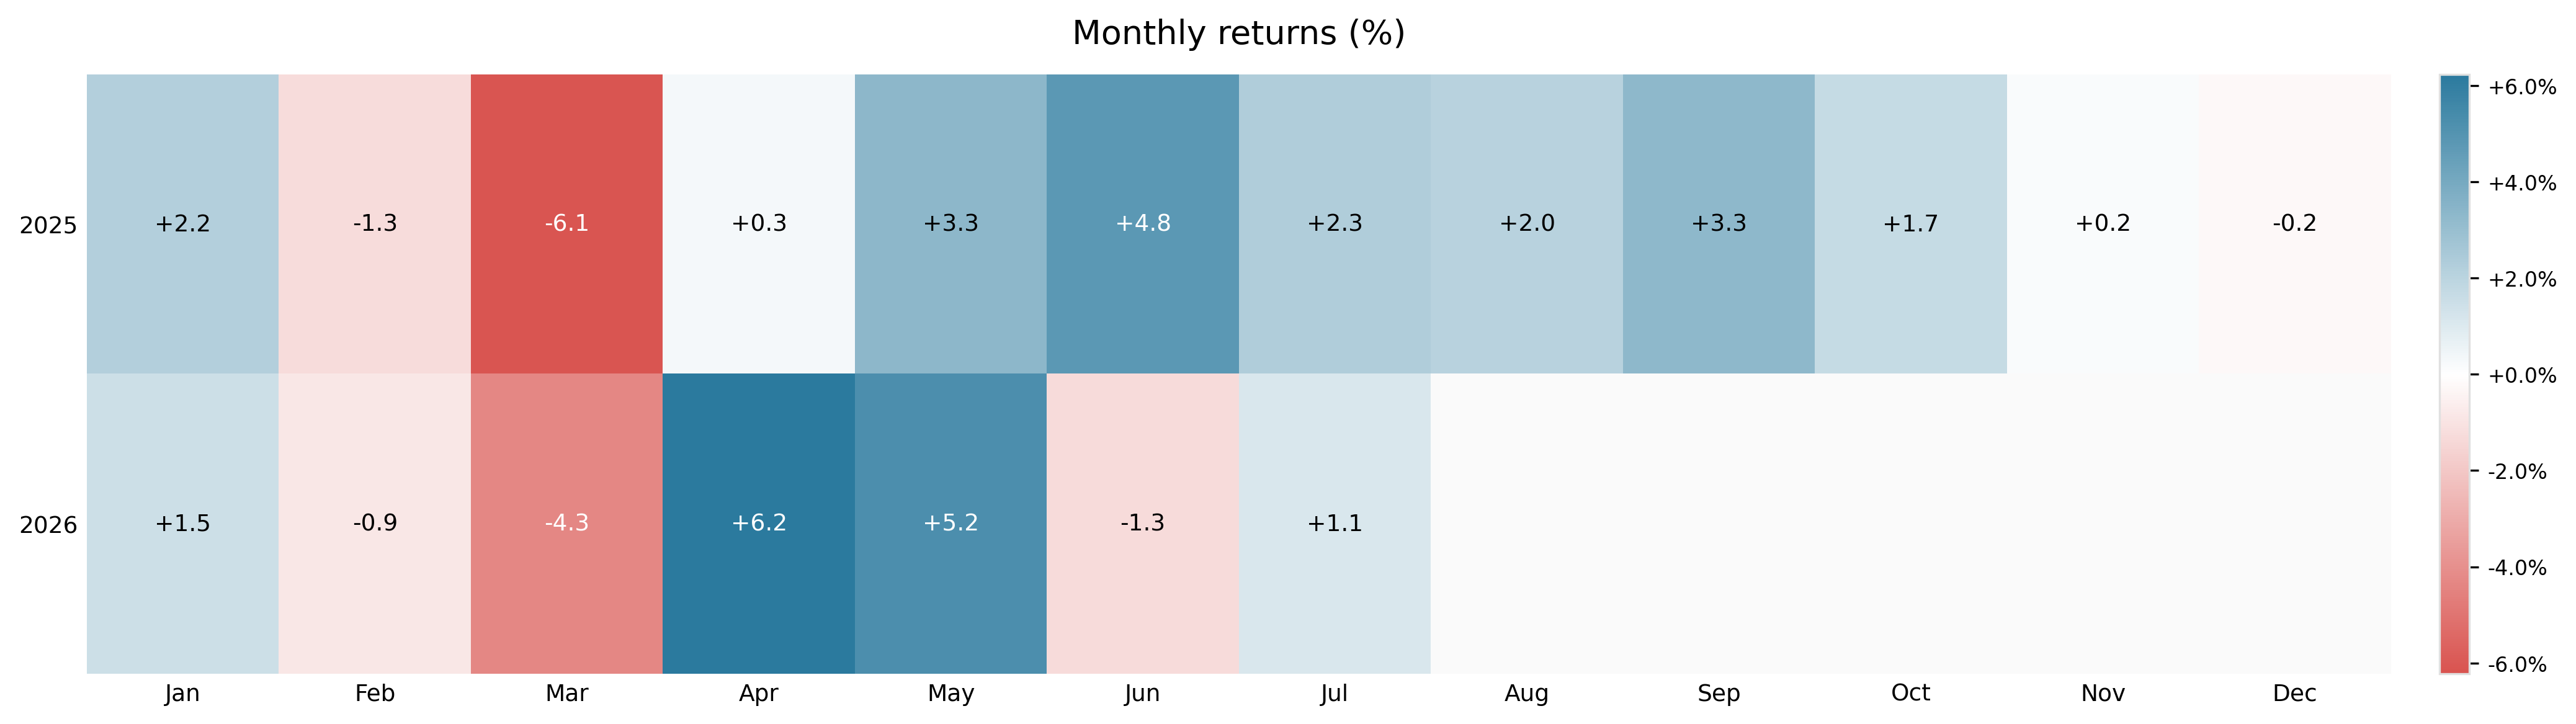
The strategy lost -4.3% in March — roughly in line with the index, because the regime shift is never instantaneous. But the exposure reduction paid off where it counts: the framework’s drawdown in this episode stayed contained while the benchmark bled deeper. And when April brought the recovery, the model had already begun scaling back in. April 2026: +6.2%. May: +5.2%. Two of the strongest months in the entire test, captured with discipline instead of hope.
The Scoreboard
Over the full 18 months:
| Metric | Strategy | Benchmark |
|---|---|---|
| Total Return | 21.15% | 28.28% |
| Annual Return | 13.60% | 18.01% |
| Volatility | 11.30% | 17.74% |
| Sharpe Ratio | 1.03 | 0.90 |
| Max Drawdown | -9.58% | -19.00% |
| Calmar Ratio | 1.42 | 0.95 |
The framework returned 21.2% cumulative versus 28.3% for buy-and-hold. Annualized: 13.6% versus 18.0%. Yes, the model underperformed on raw return. I want to be completely transparent about that, because this is the honest trade-off at the heart of regime-based allocation.
Now look at the risk side. Maximum drawdown: -9.6% versus -19.0%. Volatility: 11.3% versus 17.7%. Sharpe ratio: 1.03 versus 0.90. Calmar ratio: 1.42 versus 0.95.
The framework delivered roughly 75% of the market’s return with half the drawdown and two thirds of the volatility. On a risk-adjusted basis, it beat buy-and-hold on every metric that matters.
Ask yourself which equity curve you could actually hold. The one that fell 19% in April 2025, or the one that fell 9.6%? On paper, everyone holds through a -19% drawdown. In a real account, with real money, most investors capitulate near the bottom — and that behavioral failure costs far more than any model’s return lag. Drawdown containment isn’t an academic metric. It’s the difference between staying in the game and blowing up your process.
Final Thoughts
Eighteen months of out-of-sample data, two real corrections, zero parameter changes. The model did exactly what it was built to do: it identified both risk-off episodes, cut exposure through the worst of the damage, paid the re-entry tax on the rebounds, and stayed fully invested when conditions were healthy.
This is not a return-maximizing strategy, and it never claimed to be. It’s a risk management framework. Its value is consistency, transparency, and survivability — the qualities that keep you trading next year, and the year after.
For me, the practical application goes beyond SPY allocation. I use the regime classification as an environmental filter for my options strategies: full position sizing in Risk-On, defined-risk structures only in Caution, and premium harvesting on existing positions in Risk-Off. More on that in an upcoming article.
The complete research write-up is in the May 2026 issue of Technical Analysis of Stocks & Commodities (S&C V.44:05), and the code is on GitHub if you want to run the test yourself. As always: don’t trust me, trust the data.
This is the mindset behind The Quantitative Edge — simple ideas, implemented cleanly, that scale into powerful tools for data-driven trading.
Statemi bene!