Description
Seasonality becomes valuable when you can translate statistical tendencies into clear, repeatable trades.
In my previous article, I analyzed how seasonality can be traded using shares on SPY. Now, I move forward and show how this recurring October–December pattern can be traded using options.
One of the strongest seasonal tendencies in the S&P 500 appears during the late-autumn period:
from 26 October until around 7 December — roughly 30 trading days, where SPY historically shows a measurable positive drift.
In this article, you’ll learn:
- What the SPY late-autumn pattern looks like
- How to visualize it with Python
- How to trade it using bull call spreads or bull put spreads
- How to choose strikes and expirations based on the average historical move
Let’s get into it.
SPY’s Seasonal Edge
Looking at data since the 2000s, SPY consistently shows a stronger-than-average upward tendency from late October into early December, in particular between the 26th of October and the 7th of December.
This window typically delivers:
- A historical average gain of ~4–5%
- A positive outcome in 75–80% of years
- A smooth, low-volatility climb (ideal for spreads)
- Several years where the move is small but predictable
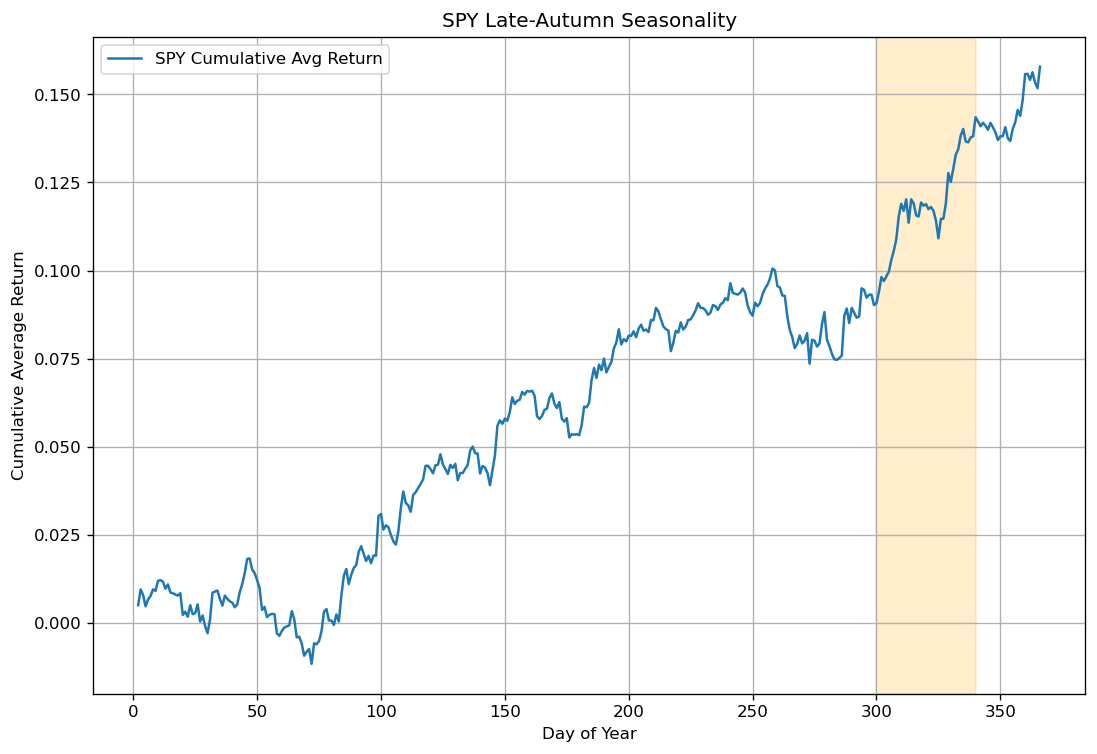
We can visualize this by computing SPY’s average daily return and cumulative seasonal curve.
import yfinance as yf
import matplotlib.pyplot as plt

t = yf.Ticker("SPY")
spy = t.history(start="2000-01-01",interval='1d', auto_adjust=False)

spy['Return'] = spy['Close'].pct_change()
spy['DoY'] = spy.index.dayofyear

avg_daily = spy.groupby('DoY')['Return'].mean()
cum_avg = avg_daily.cumsum()

plt.figure(figsize=(10,6))
plt.plot(cum_avg, label='SPY Cumulative Avg Return')

# Highlight the seasonal window (Oct 26 ~ day 300, Dec 7 ~ day 340)
plt.axvspan(300, 340, alpha=0.2, color='orange')

plt.title("SPY Late-Autumn Seasonality")
plt.xlabel("Day of Year")
plt.ylabel("Cumulative Average Return")
plt.grid(True)
plt.legend()
plt.show()
You should clearly see an upward slope during the highlighted window — that’s the edge we want to trade.
Why Use Options Instead of Shares?
If the expected move is modest (+4–5%) but consistent, options allow us to define the risk of the trade and amplify the expected returns. We can match the strikes and the expiration date exactly with the seasonal window we have measured. Furthermore, we can benefit even if SPY rises only slightly or even stays flat (with the right structure)
The two best structures are:
- Bull Call Spread (directional, debit)
- Bull Put Spread (probability-based, credit)
Let’s break them down.
Bull Call Spread
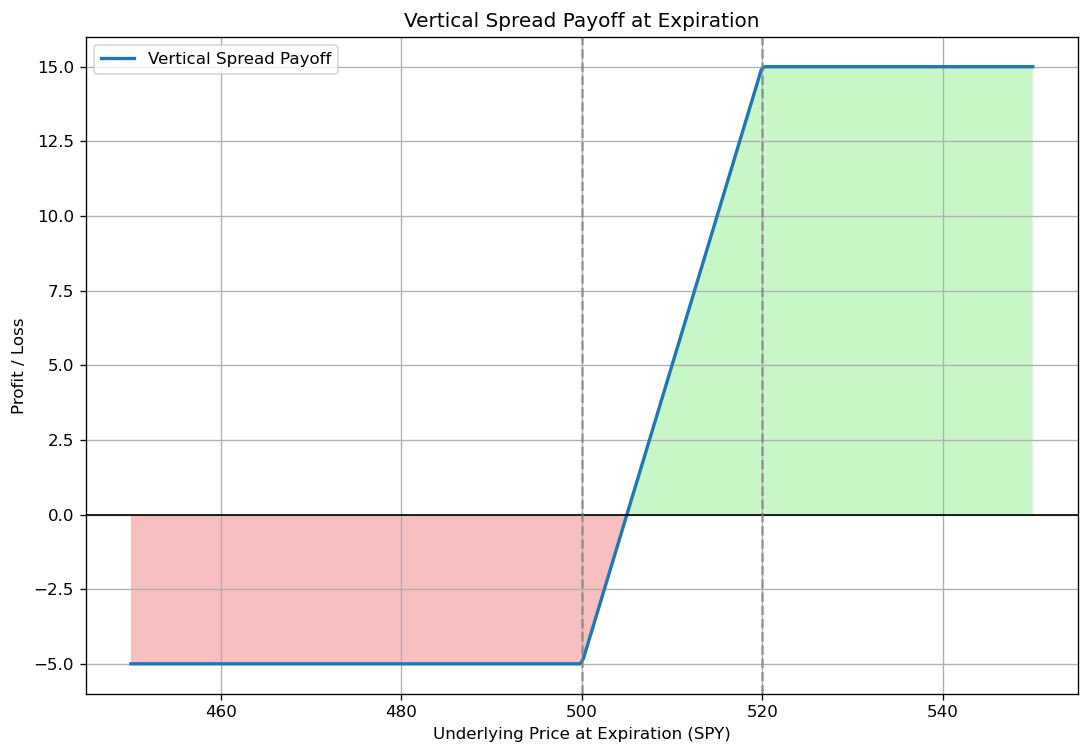
A bull call spread is a defined-risk way to target SPY’s expected +3–5% seasonal rise. This is built by:
- Buying a call at a lower strike
- Selling a call at a higher strike
It profits if SPY rises into your target range — which seasonality tells us is typically around +4% from late October to early December.
The strikes are chosen based on seasonal data. Indeed, if SPY trades at 500, and the seasonal window historically rises by ~4%, then the expected target is: 500 x 1.04 = 520. Therefore, the spread can be: Long 500 call, short 520 call. The width of your spread should roughly reflect the average seasonal gain over the past 20+ years.
For the expiration selection, since the window ends ~7 December, pick an expiration after December 7 but not too far beyond, like the December monthly chain. Your spread should expire shortly after the seasonal window ends, capturing the move without paying extra time value.
Bull Put Spread
A bull put spread is a high-probability way to monetize a mild bullish drift, and this is a credit spread, which means we receive money to open the position. The spread involves:
- Selling a put at a higher strike
- Buying a put below it
This structure profits if SPY goes up, moves sideways, or even dips slightly (your short strike acts as support). This strategy works well for the seasonality tendencies that are mild and consistent and do not have strong upside.
If SPY is 500, and the seasonal rise is typically +4%, then you can place the bull put spread underneath the price. That is: Sell 485 put, Buy 470 put. This gives SPY plenty of room to breathe. The expiration date is the same as the bull spread case.
Final Thoughts
Seasonality gives us:
- A direction
- A timeframe
- A reasonable expectation of magnitude
Options allow us to encode those expectations with exact risk and reward.
The SPY late-October → early-December pattern is one of the market’s most persistent micro-edges. It doesn’t predict the future — but it provides a statistical backbone for constructing objective, repeatable trades.
If you want the next article sent directly to your inbox, make sure you’re subscribed to the newsletter.
This is the mindset behind The Quantitative Edge — simple ideas, implemented cleanly, that scale into powerful tools for data-driven trading.
Statemi bene!