Description
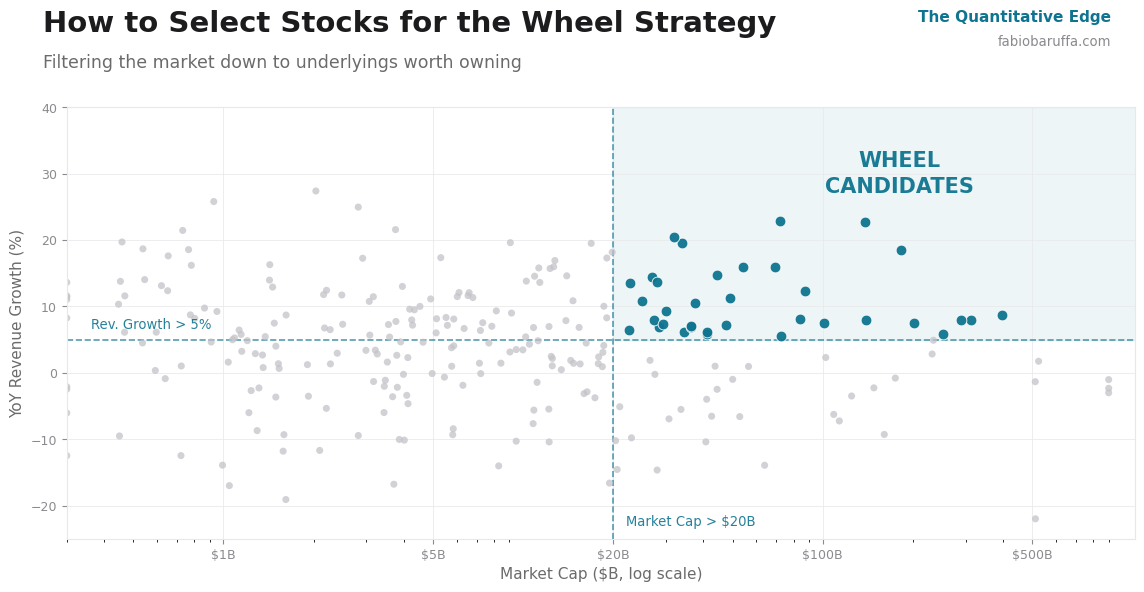
The Wheel Strategy starts with selling a put, and the first leg is where every mistake gets made: the stock you pick. In a previous article I gave you a quality screen for cash-secured puts built on standard fundamentals. It works. But then I read a 10-year study from Goldman Sachs that quantifies exactly which fundamental factor drives put-selling returns, and it isn’t implied volatility or market cap. It’s Free Cash Flow yield. In this article I break down what the study found and I upgrade my stock selection accordingly, with Python.
Introduction
If you run the Wheel, you already know the whole strategy rests on one sentence: only sell puts on stocks you would be happy to own. I wrote about the three pillars of a clean cash-secured put in Cash Secured Puts as Income Strategy — cash backing, quality stocks, neutral-to-bullish outlook — and I gave you a five-point quality screen to enforce it.
Here is the honest part. That screen was built on intuition plus sensible fundamentals: large cap, positive earnings, reasonable P/E, low leverage, above the moving averages. Reasonable. But if you had asked me which of those factors actually moves the needle on put-selling returns, I couldn’t have shown you the data. I was guessing, in an educated way.
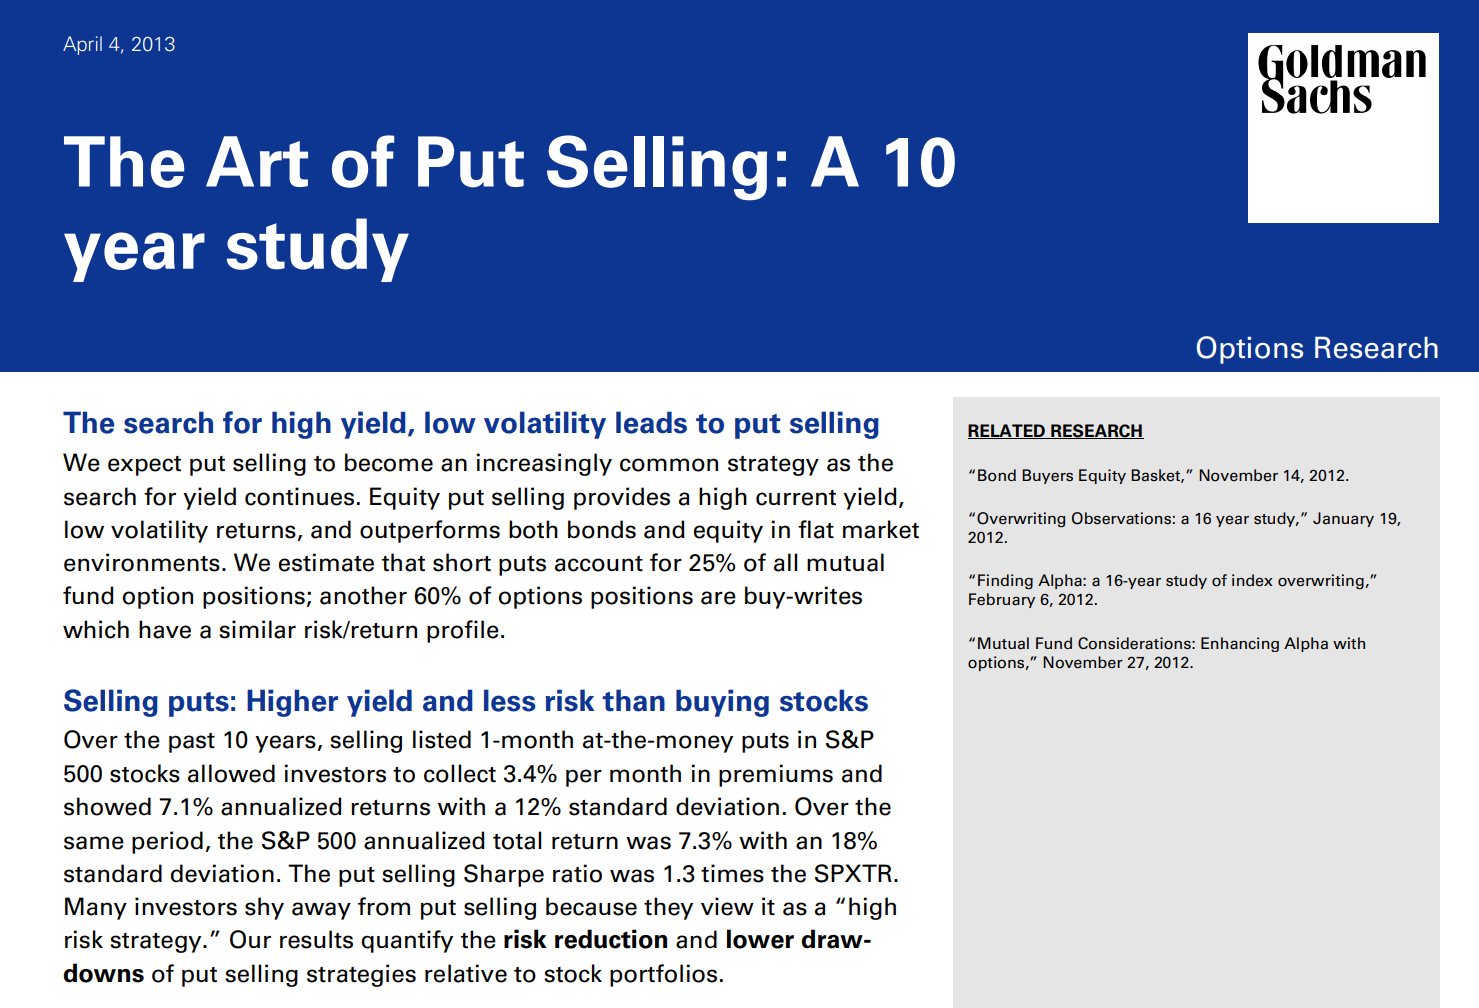
Then I went back to a piece of research I’d been meaning to read properly: The Art of Put Selling: A 10 Year Study (Goldman Sachs, April 2013). It’s a systematic backtest of selling puts on every optionable stock in the S&P 500, month after month, from 2003 to 2013. And buried in it is the answer to my question. There is one fundamental factor that consistently improved both returns and risk-adjusted returns, and it beat the factors most retail traders obsess over.
That factor is Free Cash Flow yield. Let me show you why, and then let me show you how I’m putting it into my screen.
First: Put Selling Is Not the Reckless Trade People Think
Before we get to selection, one detour, because it matters for anyone running the Wheel with a straight face.
The common objection to selling puts is that it’s a “high-risk strategy.” The study quantifies the opposite. Over the 10 years, selling 1-month at-the-money puts on the S&P 500 delivered:
- 7.1% annualized return, essentially matching the S&P 500 total return of 7.3%
- but with 12% volatility versus the index’s 18%
- which means a higher Sharpe ratio: 0.65 vs 0.49
The put seller collected roughly 3.4% per month in premium, about 40% per year, and captured about 66% of the market’s upside while eating only 55% of its downside. In 2008 — the year everybody points to — at-the-money put selling beat the S&P total return by 14%.
The reason this works is structural, not lucky. It’s the Volatility Risk Premium (VRP): the options market systematically prices in more volatility than actually shows up. Over the study period, average 1-month implied volatility was 20.1% while subsequent realized volatility was 17.1% — a persistent ~3-point gap. As a put seller you are repeatedly paid for a risk that, on average, arrives smaller than advertised. That is the engine under the Wheel.
So put selling is a legitimate, lower-drawdown way to own equity risk. Good. But the study’s most useful finding is not that it works — it’s what makes it work better.
The Real Lesson: Selection Beats the Strategy
Here’s the result that changed how I think about my screen.
The researchers sorted every S&P 500 stock into quintiles by different factors and ran the same put-selling strategy on each bucket. If selection didn’t matter, the buckets would look alike. They don’t.
Sorting by Free Cash Flow yield:
| FCF yield bucket | Annual return | Volatility | Sharpe |
|---|---|---|---|
| Lowest quintile | 4.3% | 16% | 0.36 |
| Highest quintile | 9.8% | 12% | 0.85 |
Same strategy. Same period. The only difference is the fundamental quality of the underlying you sell puts on — and it’s the difference between a mediocre 0.36 Sharpe and an excellent 0.85. Selling puts on high-FCF-yield names added roughly +250 bps a year without adding volatility.
Now compare that to the two factors most traders actually screen on:
- Implied volatility. Selling puts on the highest-IV names produced the best raw return (11.1%) — but at 20% volatility, so the Sharpe was only 0.64. You bought return with risk. That’s not an edge, that’s leverage in disguise.
- Market cap. Larger caps had better risk-adjusted returns, but mostly because volatility was lower; the returns themselves weren’t meaningfully different across the size spectrum.
Free Cash Flow yield was the one factor that improved return and risk at the same time. That’s the profile you want.
Why Free Cash Flow yield, and not earnings
This is the “why before the how,” and it’s the part I actually care about as a physicist: there has to be a causal story, not just a backtest.
FCF yield is a proxy for margin of safety. Companies generating high free cash flow relative to their price tend to have fatter margins, declining leverage, and a real cash cushion. Those are exactly the businesses with limited downside — the ones where getting assigned is an acceptable, even welcome, outcome.
And FCF is harder to fake than earnings. Companies manage EPS to hit quarterly targets all the time — accruals, one-off items, buyback optics. Cash actually generated by the business is a cleaner signal that the company is deleveraging and genuinely healthy. The study found FCF yield beat earnings yield as a selection factor for precisely this reason.
Read that back through the Wheel’s core rule. Only sell puts on stocks you’d be happy to own. FCF yield is a quantitative, backtested proxy for “a stock you’d be happy to own.” It turns the vague Assignment Test from my CSP article into a number you can rank.
Upgrading the Screen with Python
In the CSP article my screener produced a 0–5 quality score. I’m not throwing that out — the leverage and trend gates still matter. I’m promoting FCF yield to the primary ranking factor, and using the rest as filters.
First, the core metric. Free Cash Flow yield is simply free cash flow divided by market cap. One catch: the convenient freeCashflow field yfinance exposes is sometimes missing, which would silently drop good stocks from the screen. So we fall back to the actual definition — operating cash flow minus capital expenditures — pulled straight from the cash-flow statement:
import yfinance as yf

def get_fcf(ticker):
    """
    Free cash flow, robust to missing data.
    1) Use yfinance's freeCashflow field if present.
    2) Otherwise compute it: Operating Cash Flow - CapEx.
    """
    stock = yf.Ticker(ticker)

    # 1. Try the convenient field first
    fcf = stock.info.get("freeCashflow")
    if fcf:
        return fcf

    # 2. Fallback: compute from the cash-flow statement
    cf = stock.cashflow
    try:
        ocf   = cf.loc["Operating Cash Flow"].iloc[0]
        capex = cf.loc["Capital Expenditure"].iloc[0]   # already negative
        return ocf + capex
    except (KeyError, IndexError):
        return None

def fcf_yield(ticker):
    """
    Free Cash Flow yield = trailing free cash flow / market cap.
    Higher is better: more cash generated per dollar of price.
    """
    fcf  = get_fcf(ticker)
    mcap = yf.Ticker(ticker).info.get("marketCap")

    if not fcf or not mcap:
        return None
    return fcf / mcap

for t in ["AAPL", "MSFT", "JNJ", "KO", "PG"]:
    y = fcf_yield(t)
    print(f"{t}: {y:.2%}" if y is not None else f"{t}: n/a")
A word of caution either way: this is trailing free cash flow, so a one-off asset sale or a capex trough can distort it. When a yield looks surprisingly high, open the cash-flow statement and check why before you trust it.
Now the upgraded screener. It ranks candidates by FCF yield and keeps the quality gates that stop us from selling puts on a value trap:
import yfinance as yf
import pandas as pd

def screen_wheel_candidates(tickers, min_fcf_yield=0.03):
    """
    Rank Wheel / cash-secured-put candidates by Free Cash Flow yield,
    with quality gates to avoid falling knives and value traps.
    """
    rows = []

    for ticker in tickers:
        try:
            stock = yf.Ticker(ticker)
            info  = stock.info

            fcf    = get_fcf(ticker)                  # robust: field or OCF - CapEx
            mcap   = info.get("marketCap")
            eps    = info.get("trailingEps")
            de     = info.get("debtToEquity")        # yfinance reports as %
            price  = info.get("currentPrice")

            if not (fcf and mcap and price):
                continue

            fcfy = fcf / mcap

            hist = stock.history(period="1y")
            if hist.empty:
                continue
            ma200 = hist["Close"].tail(200).mean()

            # Quality gates: profitable, not over-levered, in an uptrend
            gates_ok = (
                (eps is not None and eps > 0) and
                (de  is None or de < 200) and
                (price > ma200)
            )

            rows.append({
                "Ticker":        ticker,
                "Price":         round(price, 2),
                "Mkt Cap ($B)":  round(mcap / 1e9, 1),
                "FCF Yield":     round(fcfy, 4),
                "EPS":           round(eps, 2) if eps else None,
                "Debt/Equity":   round(de, 1) if de else None,
                "Above MA200":   price > ma200,
                "Passes Gates":  gates_ok,
            })

        except Exception as e:
            print(f"⚠️ {ticker}: {e}")

    df = pd.DataFrame(rows)
    # Rank by FCF yield, but only trust names above our floor AND passing gates
    df["Candidate"] = (df["FCF Yield"] >= min_fcf_yield) & df["Passes Gates"]
    df = df.sort_values(["Candidate", "FCF Yield"], ascending=[False, False])
    return df.reset_index(drop=True)


watchlist = ["AAPL", "MSFT", "JNJ", "KO", "V", "NVDA", "META", "HD", "UNH", "PG", "CVX", "PFE"]
df = screen_wheel_candidates(watchlist)
print(df.to_string(index=False))
The names that float to the top — high FCF yield, profitable, sensible leverage, above their 200-day — are the ones the study says give you the best risk-adjusted put-selling returns. That’s your Wheel universe. Everything below the FCF-yield floor: skip it, no matter how fat the premium.
A quick bar chart makes the ranking obvious at a glance:
import matplotlib.pyplot as plt

ranked = df[df["Candidate"]].sort_values("FCF Yield")

plt.figure(figsize=(8, 5))
plt.barh(ranked["Ticker"], ranked["FCF Yield"] * 100)
plt.axvline(3.0, linestyle="--", linewidth=1)   # our 3% FCF-yield floor
plt.xlabel("Free Cash Flow Yield (%)")
plt.title("Wheel candidates ranked by FCF yield")
plt.tight_layout()
plt.show()
Bonus: the Study Also Improved Strike Selection
Here’s the part I didn’t expect. It’s not just which stock — FCF yield also improved which strike.
Instead of always selling at-the-money, the researchers targeted a premium equal to the stock’s own FCF yield. Selling 1-month puts to collect about one-twelfth of the annual FCF yield produced the highest Sharpe ratio in the entire study: 1.35, nearly triple the S&P. That approach naturally sits about 10% out-of-the-money — so you’re selling further from the money on exactly the stocks that can afford it, and getting assigned far less often.
The operational idea is simple: let the company’s cash generation set your monthly premium target, then find the OTM strike that pays it.
def target_monthly_premium(fcfy):
    """
    Translate annual FCF yield into a monthly premium target (1x FCFY / 12).
    In the study this landed ~10% OTM and gave the best risk-adjusted returns.
    """
    return fcfy / 12

fcfy = 0.06                      # 6% FCF yield stock
target = target_monthly_premium(fcfy)
print(f"🎯 Target monthly premium: {target:.2%} of strike (~0.5% here)")
# Then scan the option chain for the OTM strike whose premium ≈ this target.
Lower premium per trade, yes. But dramatically higher consistency and far fewer assignments — which, for a Wheel that has to survive drawdowns, is the whole game.
Where I’m Being Careful
I don’t want you to copy this blindly, because the study isn’t a perfect map of what we do.
- It’s index-weighted and fully diversified. Goldman sold puts across the entire S&P 500 every month. You and I run a concentrated book of a handful of names. That means single-stock risk is higher for us — so quality selection matters more, not less. This is an argument for the FCF filter, not a reason to relax it.
- Trailing FCF can lie. A one-off asset sale, a capex trough, or a buyback-heavy balance sheet can inflate the number. Glance at the cash-flow statement before you trust it.
- High FCF yield can also be a warning. Sometimes a cheap stock is cheap for a reason. That’s exactly why I keep the trend gate (above the 200-day) — the study rewards quality, but I still don’t want to catch a falling knife.
- The sample is 2003–2013. Great data, but one decade. Treat it as strong evidence, not a guarantee.
Final Thoughts
The Wheel is often taught as a mechanical loop — sell put, get assigned, sell call, repeat. But the loop is only as good as the stock you feed into it. Selection is the strategy.
What this 10-year study gave me is a way to make selection systematic instead of intuitive. My old screen asked “is this a decent company?” The upgraded one asks “does this company generate the free cash flow that the data says drives the best put-selling returns?” — and it ranks my watchlist by the answer.
Same three pillars as always: cash backing, quality stock, neutral-to-bullish outlook. I’ve just made “quality” measurable, and pointed it at the one factor the evidence supports.
This is the mindset behind The Quantitative Edge — simple ideas, implemented cleanly, that scale into powerful tools for data-driven trading.
Statemi bene!