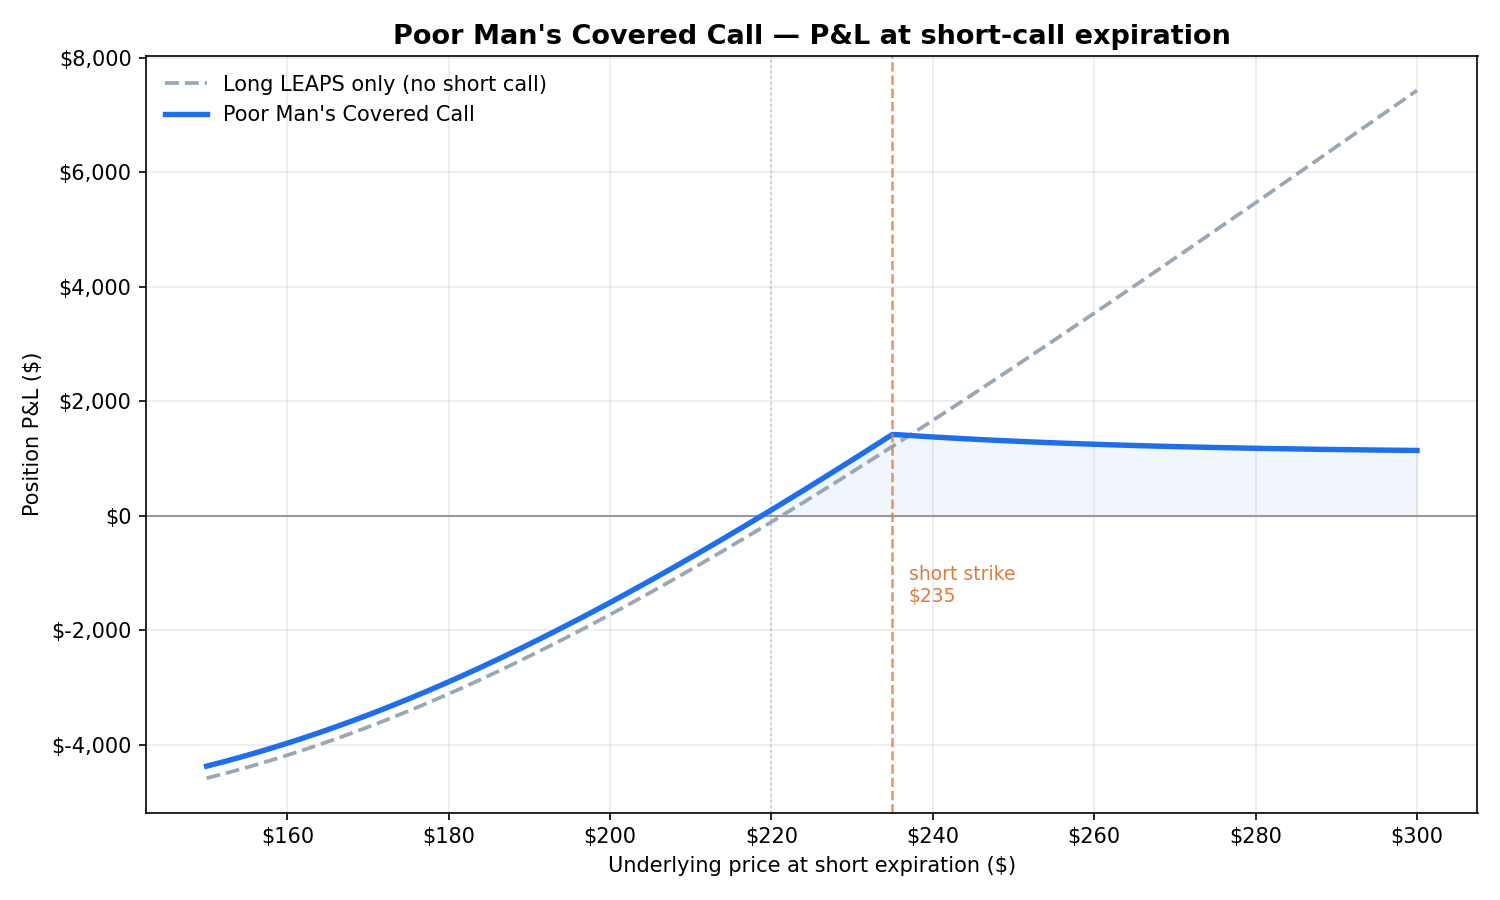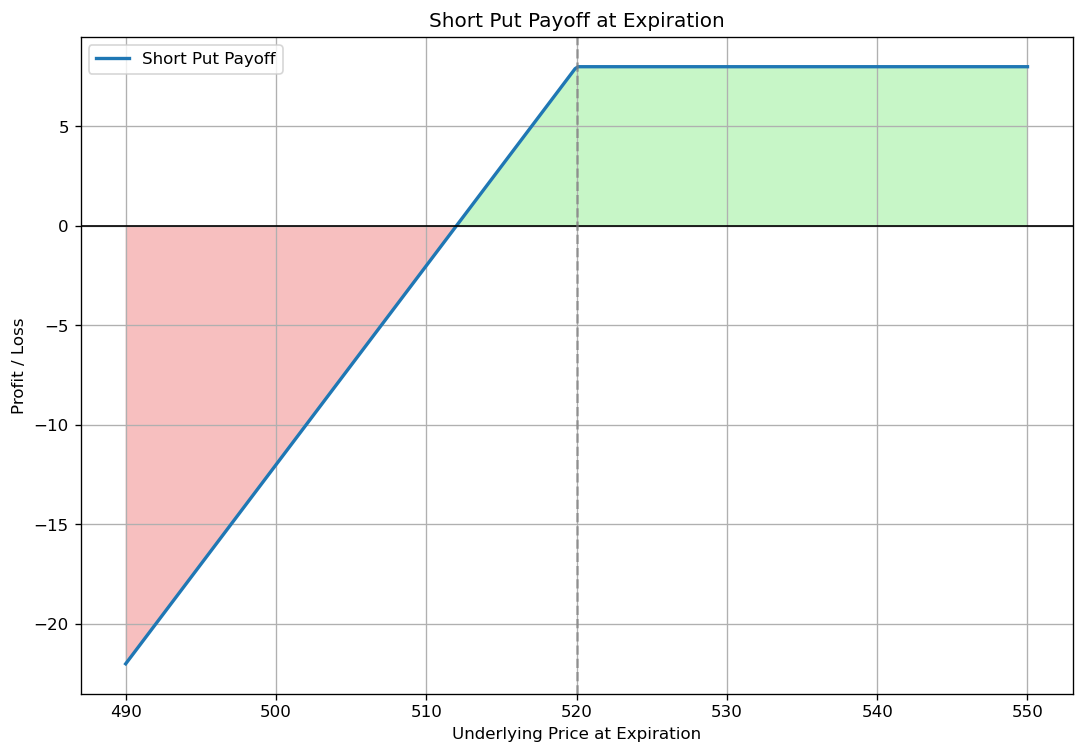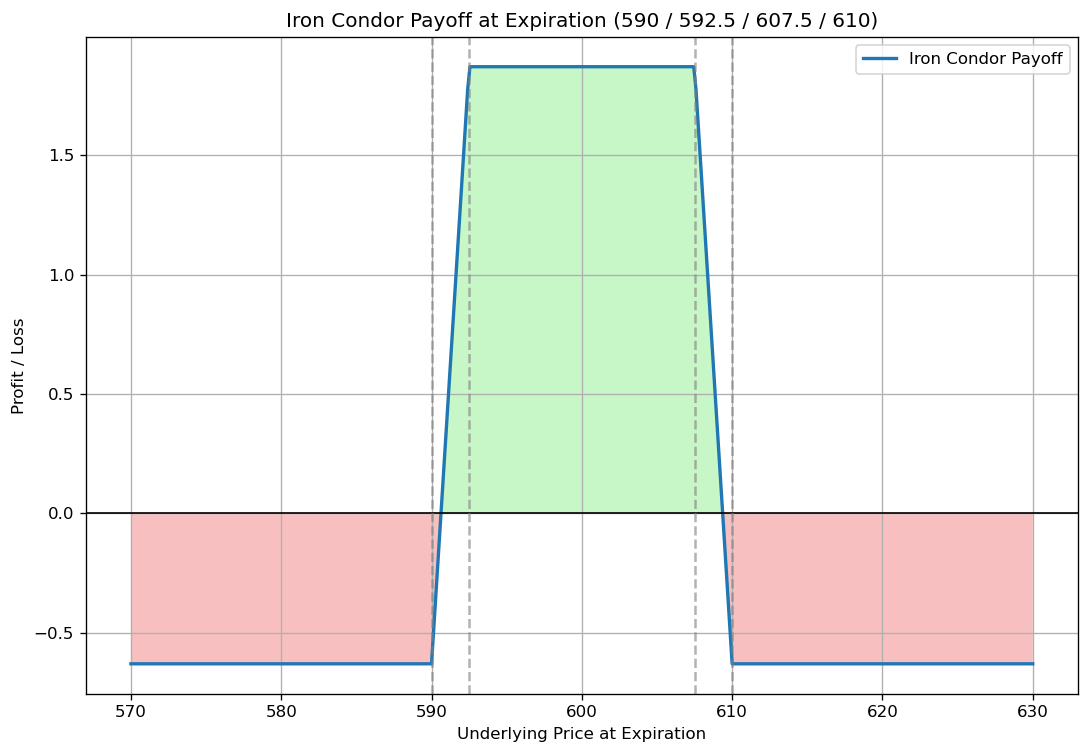
Description
If you hold stocks in your portfolio, you are sitting on an income machine that most investors never switch on.
A covered call is one of the simplest options strategies in existence: you own at least 100 shares of a stock, and you sell a call option against them. In exchange, you collect a premium, that means cash in your account, immediately. What is the trade-off? If the stock rises above your strike price, your shares get called away and your upside is capped.
That’s what is happening and the clear definition of the covered call, but it is not the complete strategy.
The strategy is knowing which strike to sell, when to sell it, and why, always based on data, calculation and market conditions, not gut feeling. That’s what I am writing about.
My MARA Position: A Real-World Case
Let me start with a real example from my own options portfolio.
I’ve been holding MARA as part of my wheel strategy. The position went through a significant drawdown — the kind that tests your discipline. I had two options: sell into weakness and lock in the loss, or put the position to work.
I chose the second. In March alone, I sold covered calls against my MARA shares and collected $571 in premium. The stock was underwater, but the position was generating cash flow every single month.
This is the part most investors miss. A stock in drawdown is not dead capital. Every premium you collect lowers your cost basis. Month after month, your breakeven moves down while you wait for the recovery. When the recovery comes — and with a systematic approach, you’ve selected stocks where it statistically tends to come — you exit from a much better position than the buy-and-hope investor next to you.
The Payoff Profile: Know What You Own
Before selling a single call, you need to understand the position you’re creating.
A covered call transforms your stock position into something different:
- Below the strike: you keep the full premium, and you still hold the stock. Your loss on a decline is reduced by the premium collected.
- At or above the strike: your shares are called away at the strike price. You keep the premium plus any appreciation up to the strike. That’s your maximum profit.
Here’s the key insight: the risk of a covered call is not the call, it’s the stock you own and want to own. Selling the call actually reduces your risk compared to holding the shares naked. The premium is acting as a cushion for your position and the real question is whether you want to own the stock in the first place.
Never sell covered calls on a stock you wouldn’t be happy holding. The premium is never big enough to fix a bad underlying.
The Why: Lowering Your Cost Basis
Let’s do the math, because the math is where the edge lives.
Suppose you bought 100 shares at $20.00. Your cost basis is $2,000.
Each month, you sell a call and collect $50 in premium (2.5% of the position). After one month, your effective cost basis is $19.50 per share. After six months, it’s $17.00. After a year, $14.00.
The stock hasn’t moved, but your breakeven has dropped 30%.
This is the core mechanic of the wheel strategy, and it’s why I keep saying: it’s not exciting, it’s effective. Premium collection is a grind. But it’s a grind that compounds in your favor, and it works in flat markets, choppy markets, and even during drawdowns — exactly the environments where buy-and-hold produces nothing.
The Systematic Part: Strike and Expiration Selection
This is where I want you to move from theory to protocol. My rules are simple and data-driven.
Strike selection by delta. I sell calls with a delta between 0.20 and 0.30. Why delta? Because delta is a rough proxy for the probability of the option expiring in the money. A 0.25 delta call has roughly a 25% chance of assignment. That means 75% of the time, I keep the premium and the shares. If I’m actively trying to exit the position, I move closer to 0.30–0.40. If I want to keep the shares, I stay near 0.20.
Expiration: 30 to 45 days. This is the sweet spot of the theta curve. Time decay accelerates in the final 30–45 days of an option’s life, which means you’re collecting premium at the fastest rate per day of risk. Weekly options look tempting, but the transaction costs and management overhead add up. I am not saying I am not trading weekly options (this is what I prefer because I have a strictly money management system), but Monthly is a good compromise.
Rolling rules. If the stock runs through my strike before expiration, I don’t panic and I follow the protocol:
- If I’m happy to sell the shares at the strike: do nothing. Let assignment happen. That’s a winning trade.
- If I want to keep the shares: roll the call up and out — buy back the current call, sell a higher strike at a later expiration, ideally for a net credit.
- Never roll for a net debit. If you can’t roll for a credit, the market is telling you something. Accept assignment and move on.
Python: Scanning the Option Chain for the Best Strike
Talk is cheap. Let’s build a small tool that you can use to scan a real option chain and shows you the trade-off between premium yield and assignment probability.
import yfinance as yf
import pandas as pd
import matplotlib.pyplot as plt

TICKER = "MARA"

# Download the ticker and pick an expiration ~30-45 days out
tk = yf.Ticker(TICKER)
spot = tk.history(period="1d")["Close"].iloc[-1]

expirations = tk.options
target_exp = expirations[1]  # adjust index to land 30-45 DTE

# Get the call chain
calls = tk.option_chain(target_exp).calls

# Keep only out-of-the-money strikes with real liquidity
calls = calls[(calls["strike"] > spot) & (calls["openInterest"] > 100)].copy()

# Days to expiration
dte = (pd.Timestamp(target_exp) - pd.Timestamp.today()).days

# Premium yield: mid price relative to the stock price
calls["mid"] = (calls["bid"] + calls["ask"]) / 2
calls["yield_pct"] = calls["mid"] / spot * 100
calls["annualized_yield"] = calls["yield_pct"] * 365 / dte

# Show the candidates
cols = ["strike", "mid", "impliedVolatility", "yield_pct", "annualized_yield"]
print(f"{TICKER} @ {spot:.2f} | Expiration: {target_exp} ({dte} DTE)\n")
print(calls[cols].round(2).to_string(index=False))
Here’s the real output from a live run on MARA on 2026-07-10:
MARA @ 12.48 | Expiration: 2026-07-17 (6 DTE)

 strike   mid  impliedVolatility  yield_pct  annualized_yield
   12.5   0.63          0.87       5.05            307.09
   13.0   0.43          0.88       3.45            209.60
   13.5   0.27          0.86       2.16            131.61
   14.0   0.17          0.86       1.36             82.87
   14.5   0.12          0.90       0.92             56.06
   15.0   0.08          0.91       0.60             36.56
   15.5   0.04          0.92       0.36             21.94
   16.0   0.04          0.97       0.28             17.06
   16.5   0.02          1.00       0.20             12.19
   17.0   0.02          1.09       0.20             12.19
   17.5   0.02          1.09       0.12              7.31
   18.0   0.01          1.09       0.08              4.87
   18.5   0.01          1.16       0.08              4.87
   19.0   0.02          1.34       0.16              9.75
   20.0   0.00          1.25       0.04              2.44
   21.0   0.02          1.56       0.12              7.31
   22.0   0.01          1.59       0.08              4.87
   23.0   0.04          2.08       0.36             21.94
   24.0   0.08          2.41       0.64             39.00
   25.0   0.02          1.97       0.12              7.31
Look at what the data reveals. With MARA trading at $12.48 and implied volatility near 87%, the 12.5 strike — barely out of the money — pays a 5% yield in just 6 days. That’s an annualized 307%. Even the 13.5 strike, comfortably above spot, yields over 2% for the week.
Two caveats before you get excited. First, this run landed on a weekly expiration (6 DTE), so the annualized numbers are dramatic — a 30–45 DTE cycle produces smaller but more manageable figures, with less gamma risk near expiration. Second, notice the noise in the far OTM strikes: mid prices of $0.01–0.02 and implied volatility jumping around above the 17 strike. That’s illiquidity talking. Those strikes are not tradeable in practice, which is exactly why the open interest filter matters.
This is also a perfect illustration of why high-IV names are covered call machines. On a blue chip with 20% IV, the same scan would show yields ten times smaller. The premium is real, but so is the volatility that generates it. You’re being paid for the risk you’re already holding.
The table gives you every OTM strike with its premium yield and annualized return. But raw yield is only half the picture, we need to see it against the probability of losing the shares. Let’s plot it:
# Approximate assignment probability using delta
# (yfinance doesn't provide delta, so we estimate via moneyness and IV)
from scipy.stats import norm
import numpy as np

r = 0.04  # risk-free rate
T = dte / 365

d1 = (np.log(spot / calls["strike"]) +
      (r + 0.5 * calls["impliedVolatility"]**2) * T) / \
     (calls["impliedVolatility"] * np.sqrt(T))
calls["delta"] = norm.cdf(d1)

fig, ax = plt.subplots(figsize=(10, 6))
ax.plot(calls["delta"], calls["annualized_yield"], "o-", color="#0e7490")

for _, row in calls.iterrows():
    ax.annotate(f'{row["strike"]:.1f}',
                (row["delta"], row["annualized_yield"]),
                textcoords="offset points", xytext=(0, 8), fontsize=8)

ax.axvspan(0.20, 0.30, alpha=0.15, color="green",
           label="Target zone (0.20-0.30 delta)")
ax.set_xlabel("Delta (≈ probability of assignment)")
ax.set_ylabel("Annualized premium yield (%)")
ax.set_title(f"{TICKER} Covered Call Scanner — {target_exp}")
ax.legend()
ax.grid(alpha=0.3)
plt.tight_layout()
plt.show()
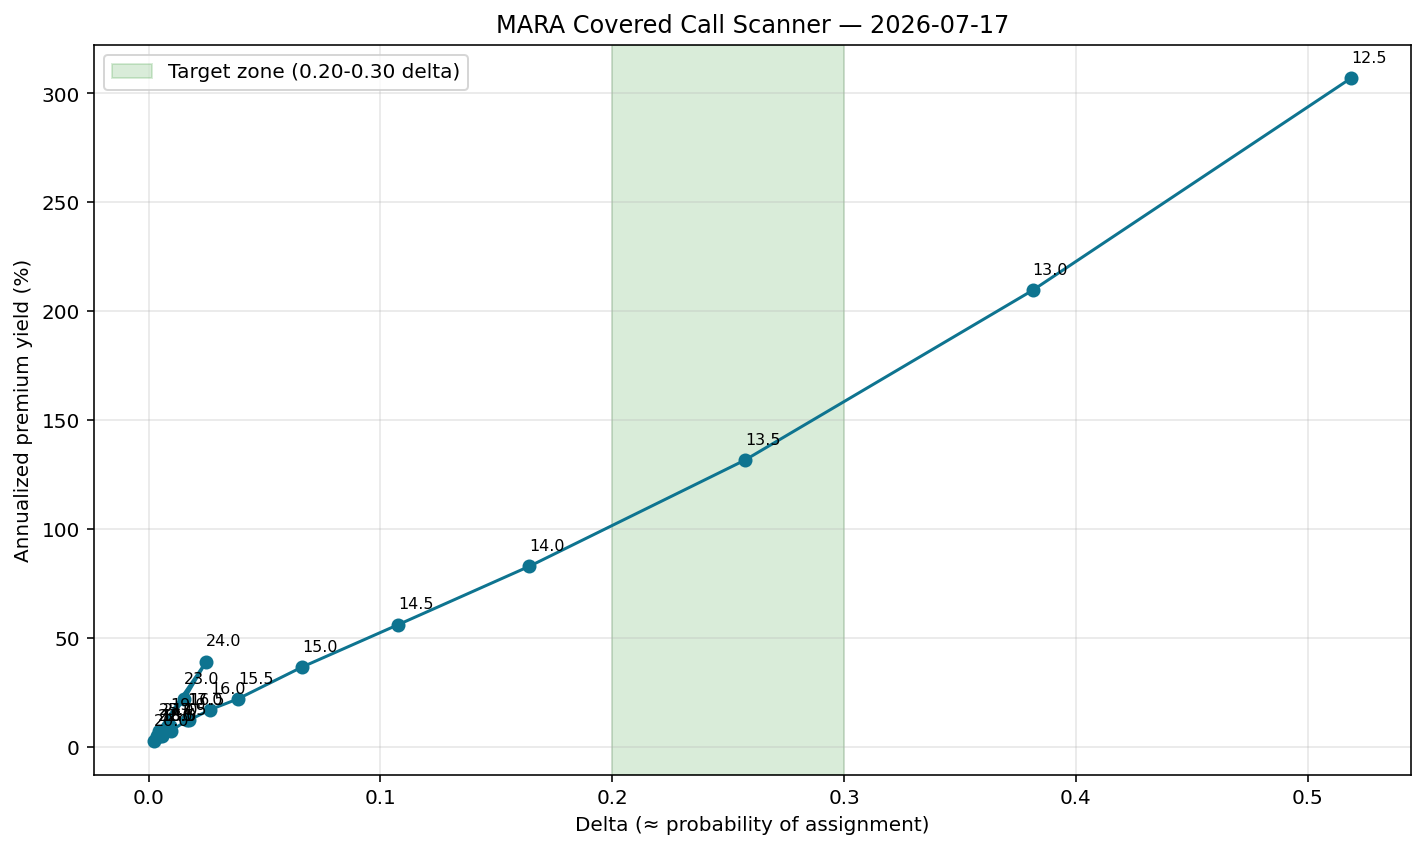
The chart tells the whole story in one image. On the left, low delta: safe, but thin premium. On the right, high delta: fat premium, but you’re basically selling your shares. The green band is where I hunt: enough premium to matter, low enough assignment risk to keep the machine running month after month.
Run this on your own holdings. You’ll be surprised how different the yield curves look across stocks. High-IV names like MARA can generate annualized premium yields that dwarf any dividend, while low-IV blue chips barely pay for the effort. The data decides where the strategy makes sense.
Common Mistakes to Avoid
Chasing premium on stocks you don’t want. High IV means high premium and high risk. The premium is compensation, not free money.
Selling too close to the money. A 0.50 delta call pays beautifully until your best position gets called away right before the big move. Respect the target zone.
Fighting assignment emotionally. Assignment at your strike is not a failure. It’s the plan working. You sold the right to your shares at a price you chose, and you got paid for it. Take the win and redeploy.
Ignoring earnings dates. Never let a covered call expiration straddle an earnings announcement unless that’s a deliberate decision. The stock can gap through your strike overnight and turn a systematic trade into a coin flip.
Final Thoughts
A covered call doesn’t fix a bad stock. But it makes a good position pay rent.
The difference between the investor who dabbles in covered calls and the trader who compounds with them is not the strategy, it’s the system. Delta-based strike selection. Fixed DTE windows. Mechanical rolling rules. Premium collected every month, cost basis dropping every month, discipline compounding quietly in the background.
My MARA position is the living proof: a drawdown that would have been pure pain as a buy-and-hold position became a monthly income stream. That’s what systematic trading looks like when the framework does the heavy lifting.
Own good stocks. Sell calls against them. Let the data pick the strike. Repeat.
This is the mindset behind The Quantitative Edge — simple ideas, implemented cleanly, that scale into powerful tools for data-driven trading.
Statemi bene!